SQL Plan For Dummies is an interactive SQL Execution Plan Viewer designed to provide visual analysis and performance insights for query execution plans. It helps users understand and optimize database queries by presenting detailed, actionable information in an intuitive interface.
Key Features:
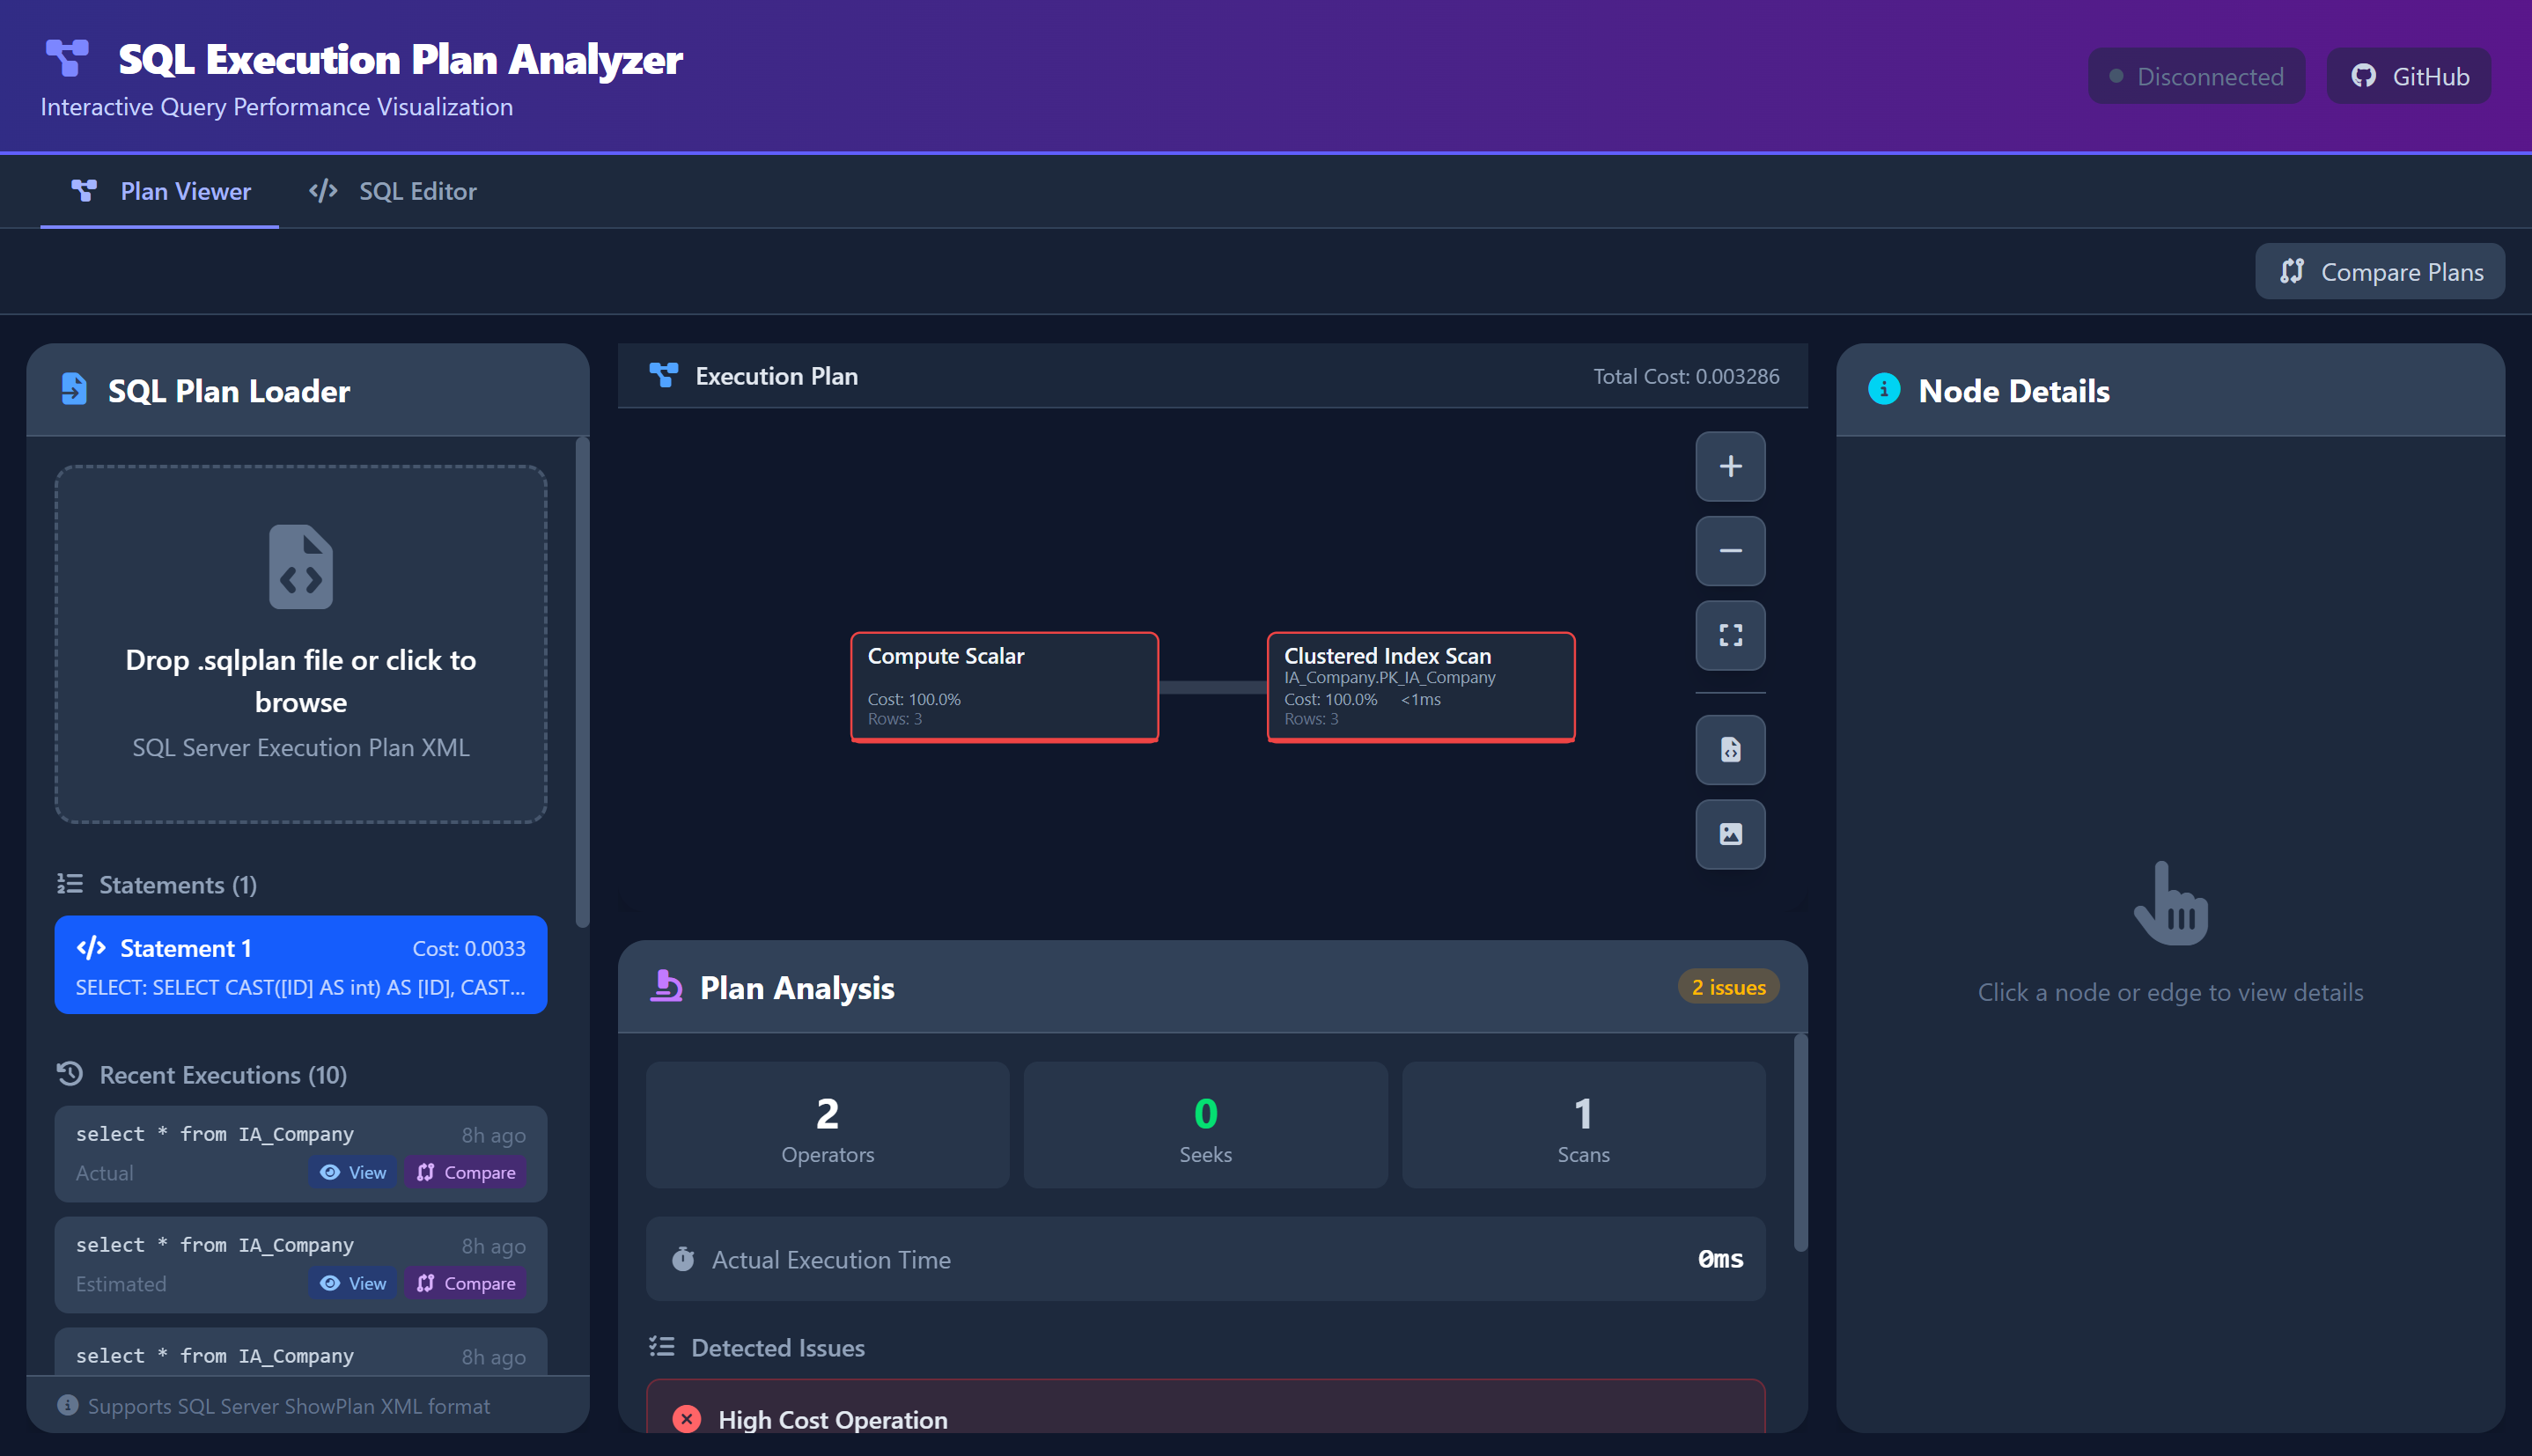
Interactive Visualization: Utilizes D3.js for a dynamic tree layout that highlights key metrics like CPU time, I/O cost, and row counts through color-coded nodes.
Detailed Node Inspection: Users can examine individual query execution steps to identify bottlenecks, view predicates, and assess memory usage.
Automated Performance Analysis: Flags common issues such as table scans, missing indexes, and spills, offering immediate feedback for optimization.
Plan Comparison: Enables side-by-side analysis of different execution plans to evaluate performance differences and cost deltas.
Export Options: Supports exporting visualizations in PNG or SVG formats for reporting and sharing insights.
Audience & Benefit:
Ideal for SQL Server DBAs, developers, and data professionals seeking to improve query performance. By identifying inefficiencies and guiding optimizations, SQL Plan For Dummies empowers users to enhance database efficiency and reduce operational costs. It is a fast, lightweight desktop application that can be installed via winget, ensuring seamless integration into daily workflows.
README
SQL Plan For Dummies
An interactive SQL Execution Plan Viewer and Extended Events Analyzer built with Tauri + Vue + D3.js that provides visual analysis and performance insights for query execution plans and XEL traces.
git clone https://github.com/PsyChonek/SqlPlanForDummies.git
cd SqlPlanForDummies
npm install
npm run tauri dev    # Development
npm run tauri build  # Production build
Prerequisites: Node.js 18+, Rust, WebView2
Usage
Getting a Plan from SSMS:
Enable "Include Actual Execution Plan" (Ctrl+M)
Run your query
Right-click the plan → "Save Execution Plan As..." → .sqlplan
Analyzing Plans:
Load: Drag & drop .sqlplan file into the app
Navigate: Click/drag to pan, scroll to zoom, arrow keys to move between nodes
Inspect: Click nodes to view details, costs, and predicates
Search: Use the search box to filter node properties by keyword
Analyze: Switch to the Analysis tab for automated performance warnings
Compare: Load a second plan for side-by-side comparison
Export: Save as PNG or SVG
Analyzing Extended Events (Windows only):
Load: Drag & drop .xel or exported .xml Extended Events files
Browse: Filter and sort events in the event table
Timeline: View event distribution over time in the Gantt-style timeline
Deadlocks: Review detected deadlock graphs and victim processes
Blocking: Inspect blocking chain diagrams to find root blockers
Dashboard: Check wait statistics and problem summary metrics
Technology Stack
Frontend: Vue 3 + TypeScript + Vite
Visualization: D3.js v7
Desktop: Tauri 2.0 (Rust + WebView2)
Supported: SQL Server 2012+ .sqlplan files (SSMS, Azure Data Studio)
FAQ
Q: Is my data sent anywhere?
A: No. The app runs entirely offline on your machine.
Q: What file types are supported?
A: SQL Server .sqlplan execution plan files and .xel/.xml Extended Events files. XEL analysis requires Windows with PowerShell.
Q: Does this work with PostgreSQL/MySQL?
A: Not yet. Only SQL Server formats are currently supported.