winproc-tui

Languages: English | Japanese
winproc-tui is a process monitoring TUI for tracking per-process resource usage over time.
It shows current values and changes over time for memory, handles, GUI resources, GPU memory, I/O, and other Windows process metrics. Up to four Graphs, A/B comparison, recording, and saved-log review support resource-behavior investigations during development and verification.
Rather than providing the broad system inspection of Process Explorer or System Informer, it focuses on quickly following changes in a specific process. It is built with Rust/Ratatui.

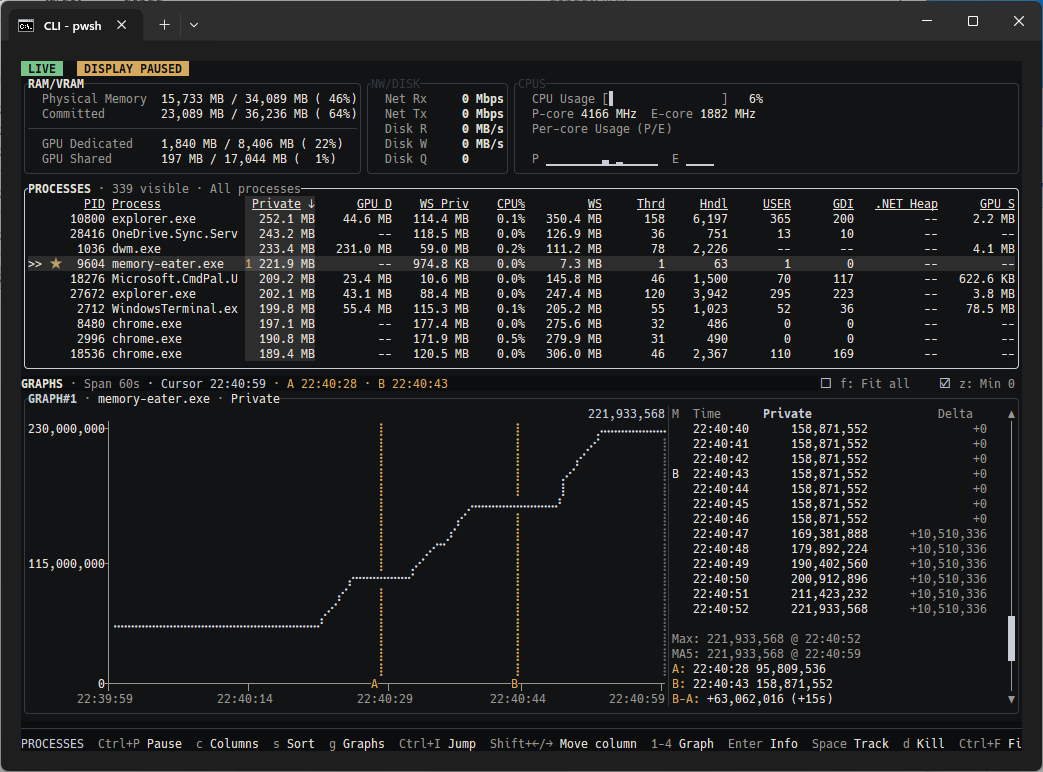
Example investigation of a process's private memory using tracking, display pause, and A/B comparison.
Quick Start
1. Launch the App
Install and launch the app with WinGet:
winget install --id TX230.winproc-tui -e
winproc-tui
Immediately after a GitHub Release, the latest version may take time to appear in the WinGet catalog, so WinGet may install an older version. The TX230 Scoop Bucket does not go through WinGet review or publication, so after the bucket is updated, run scoop update to install the latest version without waiting for WinGet. To use the latest version before the bucket is updated, download the zip from GitHub Releases, extract it, and run winproc-tui.exe. No additional runtime is required.
The upper panels show system-wide RAM / VRAM, network / disk activity, and CPU usage. The PROCESSES panel lists running processes. Use Tab / Shift+Tab to move between panels and the arrow keys to select rows and columns.
RAM / VRAM, average CPU usage, and NW/DISK System Activity retain history automatically from startup without registering a process name. The Tracked List applies only to process names.
2. Graph Process Metrics
- In
PROCESSES, select the process you want to inspect.
- Use
Left / Right to select the metric column you want to inspect. For example, Private is the process's private memory usage.
- Press
1 to show that metric in GRAPH#1.
- Use
2 – 4 in the same way to compare up to four metrics.
Press the same number again to clear that Graph slot, or press 0 to clear all Graphs. You can also select a metric in the RAM / VRAM, NW/DISK, or CPUS panel and assign it to a Graph with 1 – 4.
3. Compare Two Points
Move focus to a Graph or Samples table, then use Left / Right to select a sample. Press a at the start point and b at the end point. The A/B display shows the value difference and elapsed time. Press x to clear the comparison.
4. Track and Record a Process
- In
PROCESSES, select a process. If there is no reverse-video T beside its name, press Space to add the name to the Tracked List. Space toggles the registration.
- For targets you use repeatedly, press
Ctrl+T and save the Tracked List with a name.
- If needed, press
t to switch between All processes and Tracked only. Tracked only view is not required for recording.
- Press
Ctrl+R, choose a save path, and confirm to start recording.
- Press
Ctrl+R again to stop recording and close the log.
- Press
Ctrl+L to select and inspect a saved log.
Recording requires at least one process name in the Tracked List. It can still start when no matching process is currently running. RAM / VRAM, average CPU usage, and System Activity require no registration and are recorded in every frame; the process list remains empty until a match appears.
The Tracked Lists dialog is split into an upper area for loading a list and a lower area for saving the current Tracked List. The upper area always starts with the built-in Empty (default) entry, followed by saved named lists. Select a row and press Enter to load it; clicking Empty (default) also loads it directly. Loading that entry empties only the working Tracked List, preserves the independent Tracked-only setting, and uses the same confirmation as a named-list load when older retained history would be discarded. The active entry has a (*) suffix. The built-in entry is active only when the working list is empty and no named list is active. It is never persisted and cannot be renamed with F2, deleted with Delete, or overwritten by Save. Saved-list rows preview their process names on the right; when they do not fit, the preview keeps leading names and shows the remaining count. In the lower area, the list-name field is prefilled with the current named Tracked List. Save stores the currently tracked processes under that name, creating a new list or updating an existing one. The save result appears directly below the name field. Use Tab / Shift+Tab to move focus between the list, name field, and buttons. Moving the mouse over a button also highlights that target.
Essential Keys
| Key | Action |
|---|
Tab / Shift+Tab | Move between panels. |
| Arrow keys | Select a row, column, or sample. |
1 – 4 | Assign the selected metric to a Graph. |
Space | Add/remove a process name in Tracked List. |
t | Switch between All processes / Tracked only. |
Ctrl+T | Open named Tracked Lists. |
Ctrl+F | Filter the process list. |
Ctrl+R | Start/stop recording. |
Ctrl+L | Open a saved log. |
? | Show all key bindings. |
q / Esc | Go back or open the quit confirmation. |
Features
- Monitoring: Shows RAM / VRAM, network and disk activity, a compact CPU panel with average and per-logical-CPU load, and key per-process metrics in a table. Sorting, column selection, filtering, and jump search help you narrow down the target.
- Graphing: Lays out selected metrics in up to four Graph / Samples slots so you can review time-series movement and individual sample values. General process history keeps about 120 seconds, while tracked-process and system-metric history (RAM / VRAM, System Activity, and CPU average) keeps about 7,200 seconds.
- Tracking (Tracked List): Registers process names of interest and can show only tracked rows. Lists can be named, saved, and switched for different tasks, and startup can resume the last working list, choose a saved list, or start empty. Last collected values remain visible after processes exit. RAM / VRAM, average CPU usage, and System Activity always retain history without registration.
- Recording and Log view: Saves tracked processes, RAM / VRAM, CPU average, and system activity values as JSON Lines logs and opens them later in the same Processes / Graph / Samples / A/B layout.
- A/B comparison: Marks any two points as A and B, then shows the value difference and elapsed time between them.
- Open files: Lists the files a selected live process has open.
- Interaction support:
Ctrl+C copies the selected row to the clipboard, F2 switches themes, and mouse-based row selection and scrollbars are supported.
When This Helps
- You want to investigate whether an application's memory usage keeps increasing.
- You want to measure how memory or handle counts change before and after an operation.
- You want to inspect currently open files for clues when investigating missed file closes.
- You want to record a background service over a long period and review the area around an incident in Log view.
- You want to compare resource usage before and after a refactor.
Requirements
This project is Windows-only. Linux, macOS, and other platforms are not supported.
Administrator privileges are not required for normal monitoring. Some metrics and Open files may be unavailable for protected processes; unavailable values are displayed as -- or a diagnostic state.
Use a Prebuilt Binary
Install with WinGet
winget install --id TX230.winproc-tui -e
After installation, run winproc-tui from any directory. Use these commands to update or uninstall it:
winget upgrade --id TX230.winproc-tui -e
winget uninstall --id TX230.winproc-tui -e
After a new GitHub Release, publication of the corresponding version to the WinGet catalog may take some time. During that interval, winget install may install an older version. Check the catalog version with winget show --id TX230.winproc-tui -e; if it is older than the latest Release, wait for the catalog update or use the zip from GitHub Releases. The TX230 Scoop Bucket does not go through WinGet catalog review or publication. After its manifest is updated, run scoop update below to refresh your local bucket and use the latest version without waiting for WinGet.
Install with Scoop (TX230 Bucket)
scoop bucket add tx230 https://github.com/TX230/scoop-bucket
scoop install tx230/winproc-tui
After installation, run winproc-tui from any directory. To update, first run scoop update to refresh the local manifests for registered buckets, then run scoop update winproc-tui. Running only scoop update tx230/winproc-tui may not detect the latest version when the local TX230 Bucket is stale. Use these commands to update or uninstall it:
scoop update
scoop update winproc-tui
scoop uninstall winproc-tui
A normal uninstall preserves the application settings. To remove them as well, use scoop uninstall --purge winproc-tui.
The TX230 Bucket downloads the zip from the official GitHub Release, verifies its SHA256 hash, and registers the winproc-tui command. No additional runtime is required.
Extract the zip manually
Download the zip from GitHub Releases, extract it to any folder, and run winproc-tui.exe. No additional runtime or installer is required.
The current packaging workflow includes only winproc-tui.exe and LICENSE. Documentation such as the README remains on GitHub and is not included in new distribution archives. The v0.4.0 zip predates this policy and also contains the README files, assets/, and docs/.
Official release binaries are published only from TX230/winproc-tui Releases. The WinGet package and TX230 Scoop Bucket use these Release binaries.
Binaries from third-party copies, mirrors, or modified repositories are not official builds.
Download both the zip and its corresponding .zip.sha256 file from the Release. Use these PowerShell commands to calculate the zip's SHA256 hash and display the published value:
Get-FileHash .\winproc-tui-X.Y.Z-windows-x64.zip -Algorithm SHA256
Get-Content .\winproc-tui-X.Y.Z-windows-x64.zip.sha256
Confirm that the Hash value from Get-FileHash matches the leading hash value in .zip.sha256.
Build From Source
If you want to try in-development code, you can build from source.
1. Install the Rust Toolchain
On Windows, rustup is recommended.
Building requires Rust 1.95.0 or later, the Rust 2024 edition, and the MSVC linker (the C++ toolchain from Build Tools for Visual Studio 2026).
Using winget:
winget install --id Rustlang.Rustup -e
winget install --id Microsoft.VisualStudio.BuildTools -e --override "--add Microsoft.VisualStudio.Workload.VCTools --includeRecommended --quiet --wait --norestart"
Verify the installation:
rustup --version
rustc --version
cargo --version
2. Build and Run
git clone https://github.com/TX230/winproc-tui.git
cd winproc-tui
cargo build --release
The executable is generated at target\release\winproc-tui.exe.
The repository's Cargo configuration statically links the Microsoft C runtime into Windows x64 builds.
After building, launch it in either of the following ways:
cargo run --release
# or run the built binary directly
.\target\release\winproc-tui.exe
3. Install as a Command (Optional)
Running cargo install --path . installs winproc-tui.exe into your per-user cargo bin directory (by default %USERPROFILE%\.cargo\bin).
That directory is on your PATH, so afterwards you can launch the tool from anywhere by simply typing winproc-tui.
cargo install --path .
winproc-tui
Command-Line Options
There are currently only two startup options.
| Option | Description |
|---|
-h, --help | Show help. |
-V, --version | Show version. |
Controls Reference
Only the main controls are listed in this README.
Press ? while running to view the full key bindings in the Help dialog.
Some single-letter keys such as f map to different actions depending on which panel is focused. The Footer does not repeat the active panel name; it places ? Help at the left edge so it remains visible at narrow widths. In Live and Recording, Ctrl+P Pause follows it across panels; it is omitted in Log view, where display pause is unavailable. The predictable Tab focus-cycle shortcut is omitted from the footer. The tables below list the main controls by panel.
General
| Key | Action |
|---|
? | Show / hide Help. |
q / Esc | Open the quit confirmation (returns to live display from Log view). |
Tab / Shift+Tab | Move focus. |
Ctrl+C | Copy the selected row text from the focused panel. |
Ctrl+L | Open the log list. |
Ctrl+T | Open Tracked Lists to load the built-in empty list, manage named lists, and set startup behavior. |
Ctrl+R | Start / stop recording. |
Ctrl+P | Pause / resume display updates; sampling and recording continue (unavailable in Log view). |
Ctrl+Wheel | Change the Windows Terminal zoom level. |
F2 | Switch theme. |
Process Controls
| Key | Action |
|---|
Ctrl+F | Filter the process list by name, or by executable path when the Full Path column is selected. |
Ctrl+I / Ctrl+J | Process-name incremental search. |
1 – 4 | Show the selected process, RAM / VRAM, NW/DISK activity, or CPU Usage metric in Graph#1 – Graph#4 (press the same number again to clear). |
0 | Clear all Graphs and close the Graph panel. |
s | Sort by the selected column (press again to switch ascending / descending). |
c | Open the column picker. |
Shift+Up/Down | Select a continuous range of live process rows. |
Ctrl+Up/Down | Move the cursor without changing the multi-selection. |
Ctrl+Space | Add or remove the current live process row from the multi-selection. |
Shift+Left/Right | Move the selected metric column left or right. |
w / Shift+W | Widen or narrow the selected column by one cell. |
Space | Add or remove the selected process name from the Tracked List. |
d / Delete | Confirm, then kill the selected live process rows with taskkill /f /im. |
t | Toggle whether only tracked processes are shown. |
Enter | Open Process Info for the selected process. |
i | Open the System Info dialog. |
f | Open the Open files list for the selected live process. |
g | Open or close all configured Graphs at once. |
Process Info keeps the selected process's static information at the top and lists all 14 normally sampled numeric process metrics below it. Set A and optionally B in Graph or Samples before pressing Enter: with A only, the dialog shows Current minus A; with both points, it shows B minus A. Missing exact-time samples remain --. The dialog can be scrolled with Up / Down, PageUp / PageDown, Home / End, or the mouse wheel.
Graph and A/B Comparison
| Key | Action |
|---|
Enter | Open Process Info for the active process Graph. |
Left / Right | Move the selected sample. |
Ctrl+Left / Ctrl+Right | Pan the visible range. |
Right drag / Ctrl+left drag | Pan the visible range with the mouse. |
PageUp / PageDown | Change the visible time span. |
f | Switch to a time span that fits all samples. |
z | Toggle the Y-axis lower bound between fixed at 0 and following the visible minimum. |
v | Show or hide the Samples table. |
d | Show or hide the Delta column in Samples. |
l | Switch Graph slots between one and two columns. |
a / b | Mark the selected sample as point A or point B. |
Shift+A / Shift+B | Jump to point A or point B. |
x | Clear the A/B comparison. |
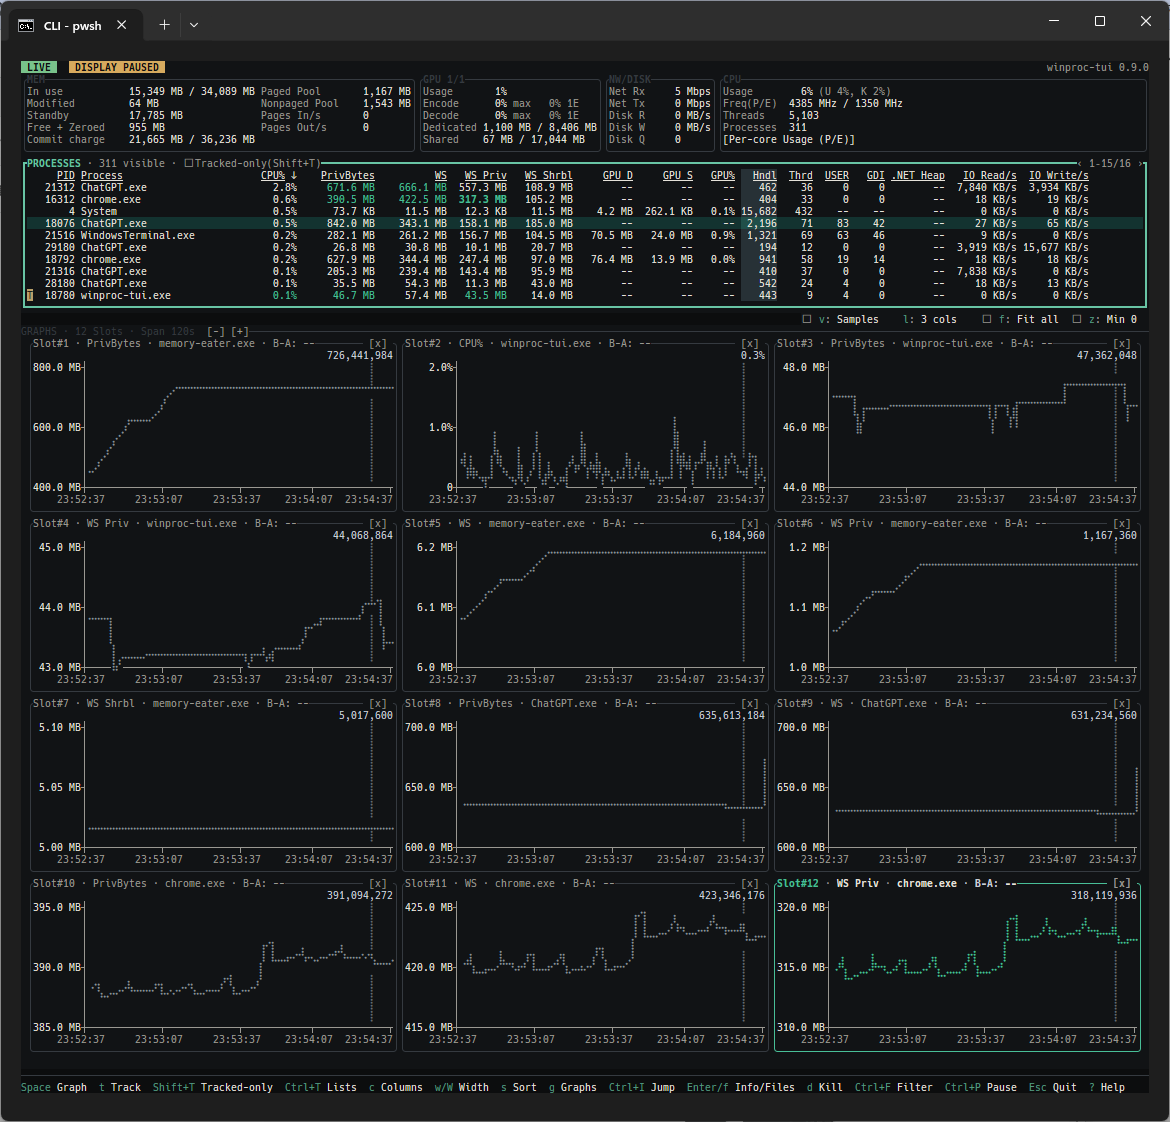
Shared Graph controls appear once above the complete Graph area: visible time span, cursor and A/B times, plus the v: Samples, d: Delta, l: 2 cols, f: Fit all, and z: Min 0 checkboxes. The checkboxes can also be clicked. Each slot uses one frame titled GRAPH#n · item · metric [unit] · B-A: value, with its Graph and synchronized Samples table grouped inside that frame. Units already present in names such as CPU% are not repeated. The title computes B-A from that slot's own metric values and shows -- when either point is unset or the slot has no value at either exact time. The active slot title is emphasized and inactive slot titles are muted.
The shared v, d, l, f, and z shortcuts work while either the Graph or Samples part of a slot has focus.
With the Graph part of a process slot focused, Enter opens Process Info for that slot's process without changing the selected Processes row. System Graphs do not have process details.
In two-column mode, slots use row-major order: upper left, upper right, lower left, then lower right. A single Graph uses the full width, and three Graphs leave the lower-right cell empty. Two-column mode hides Samples and restores its previous visibility when returning to one column. Enabling Samples with v while in two-column mode also switches to one column.
When multiple Graphs are shown, the visible time span, cursor position, and A/B points are shared across slots, while the Y-axis scale, sample availability, and value labels remain independent per Graph. Byte-based Y-axis ticks use compact adaptive units such as 5.9 MB; count ticks remain integers. The shared reduced tick width is reclaimed by every plot. Samples, cursor labels, A/B values and deltas, clipboard output, and recording logs retain exact values. If a selected Samples value is outside the current Graph range, the time window moves only as far as needed to reveal it. Switching from one to two columns and adding a Graph are rejected with Not enough display area. when the available area is insufficient. Switching from two columns to one removes the highest-numbered Graph slots until the remaining slots fit, using the same behavior as a terminal resize. The same cleanup applies when v enables Samples from two-column mode.
Recording and Log View
Press Ctrl+R to start or stop recording.
Recording requires at least one Tracked List entry and saves logs as JSON Lines (with the .log extension).
Each frame records system metrics such as RAM / VRAM, CPU average, and System Activity, plus any live processes that match the Tracked List.
If no matching process is currently running, the frame still records system metrics and writes an empty process list until a matching process appears.
When recording starts, a save-path input dialog opens, and Tab completes directory names there.
Log view cannot open during recording, and recording cannot start while Log view is open.
Press Ctrl+L to open the log list.
The list shows *.log files from the previous recording directory if available, otherwise from the current directory.
The Dir row shows the directory currently being searched, and d lets you choose another directory.
Press Enter on a selected log to switch to the LOG display and inspect the saved session through Processes / Graph / Samples / A/B comparison.
Log view is not a player: Processes keeps showing the last recorded values, while Graph, Samples, and Process Info expose the recorded metric history. Process Info uses recorded fields for static details and shows -- for details that were not recorded. Press Esc to return to the live display.
The recording log format and the meaning of each field are described in docs/metrics.md.
Saved Settings
The theme, Graph and Samples / Delta visibility, process-table columns, sort, and widths, Tracked Only state, working Tracked List, and saved named lists are saved automatically and restored on the next launch. Tracked Lists startup behavior and explicit Save, Rename, and Delete actions are saved when performed. Filter input is not carried over to the next launch.
Developer Docs
Non-Goals
winproc-tui does not aim to be:
- A full replacement for Process Explorer or System Informer.
- A tool that assumes administrator privileges for detailed collection.
It is a tool for quickly observing process changes during short development and verification sessions.
Bug Reports and Feature Requests
Please report bugs and request features via GitHub Issues.
Templates are provided for both bug reports and feature requests.
This is a personal project. Unsolicited pull requests from external contributors are not accepted; use Issues for feedback and feature requests instead.
Issues may be written in either English or Japanese. The user-facing README is maintained in both languages, while detailed specification documents under docs/ are kept in English only.
License
MIT License. See LICENSE for details.