
A log file highlighter
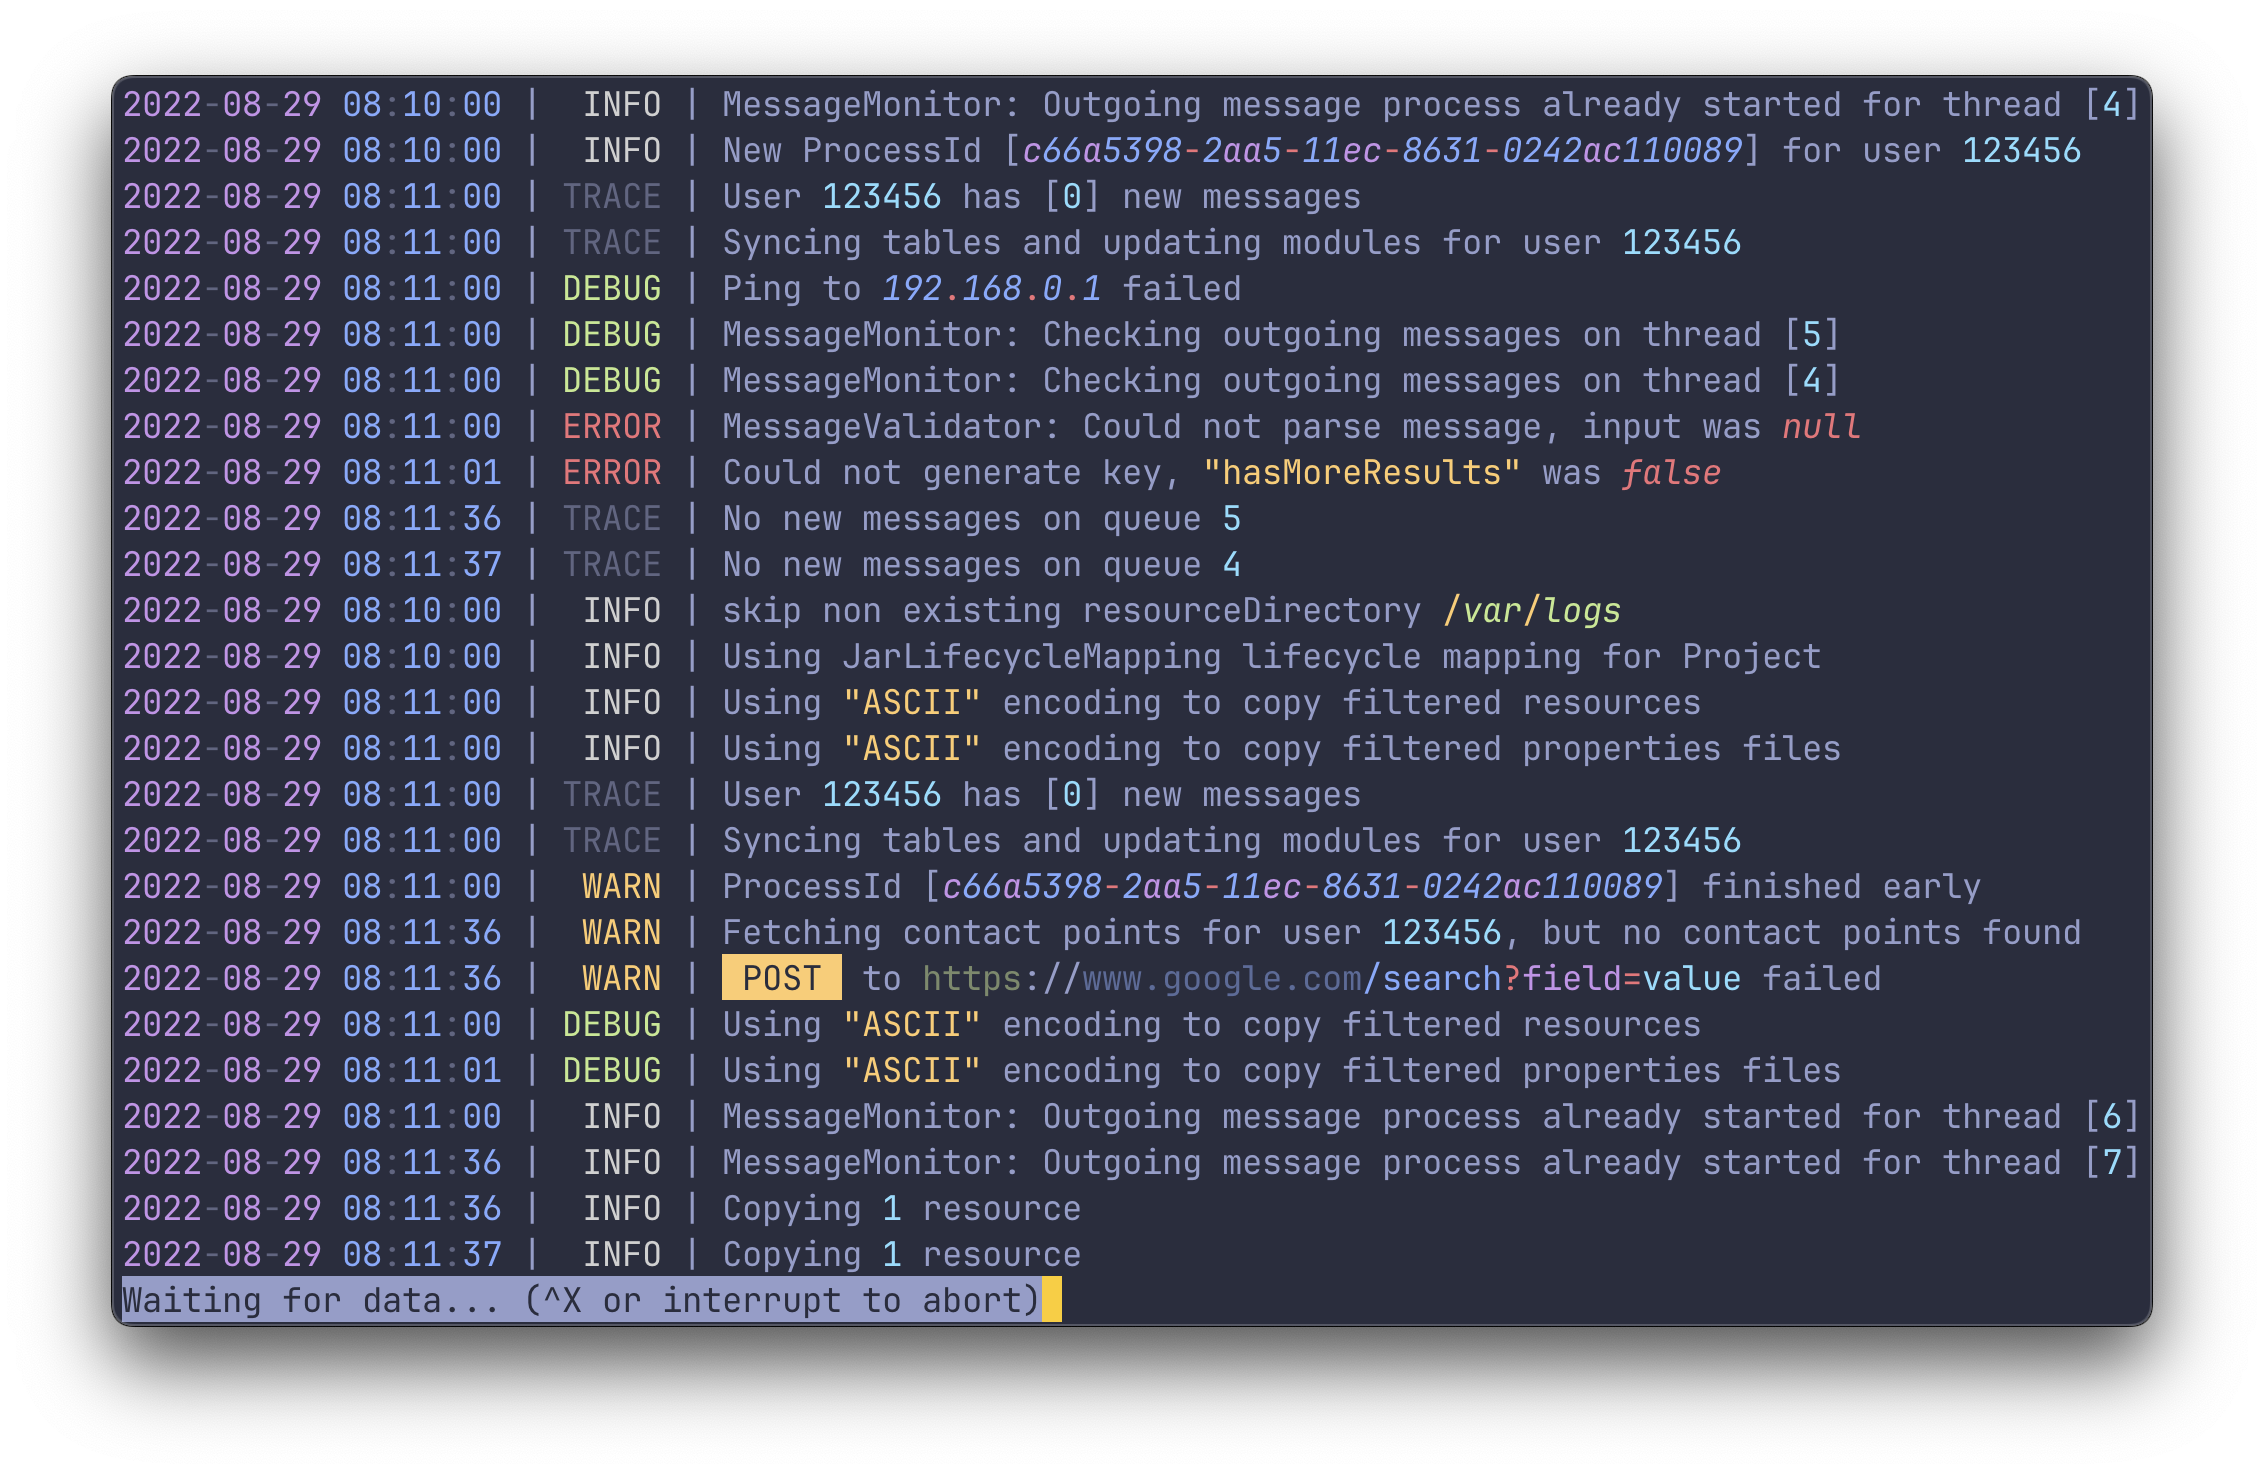
Features
- 🪵 View (or
tail) any log file of any format
- 🍰 No setup or config required
- 🌈 Highlights numbers, dates, IP-addresses, UUIDs, URLs and more
- ⚙️ All highlight groups are customizable
- 🧬 Easy to integrate with other commands
- 📦 Also available as a crate
Table of Contents
Overview
tailspin works by reading through a log file line by line, running a series of matchers
against each line. The matchers recognize patterns you expect to find in a logfile, like dates, numbers, severity
keywords and more.
tailspin does not make any assumptions on the format or position of the items it wants to highlight. For this reason,
it requires no configuration and the highlighting will work consistently across different logfiles.
Usage
The binary name for tailspin is tspin.
# Read from file and view in `less`
tspin application.log

# Pipe something into `tspin` and print to stdout
echo "hello null" | tspin

# Read from stdin and print to stdout
kubectl logs [pod_name] --follow | tspin

# Run the provided command and view the output in `less`
tspin --exec='kubectl logs -f pod_name'
Installing
Expand to view
Package Managers
# Homebrew
brew install tailspin

# Cargo
cargo install tailspin

# Archlinux
pacman -S tailspin

# Nix
nix-shell -p tailspin

# NetBSD
pkgin install tailspin

# FreeBSD
pkg install tailspin

# Windows
scoop install tailspin
From Source
cargo install --path .
Binary will be placed in ~/.cargo/bin, make sure you add the folder to your PATH environment variable.
> [!IMPORTANT]
> When building from source, make sure that you are using the latest version
> of less.
Highlight Groups
Defaults
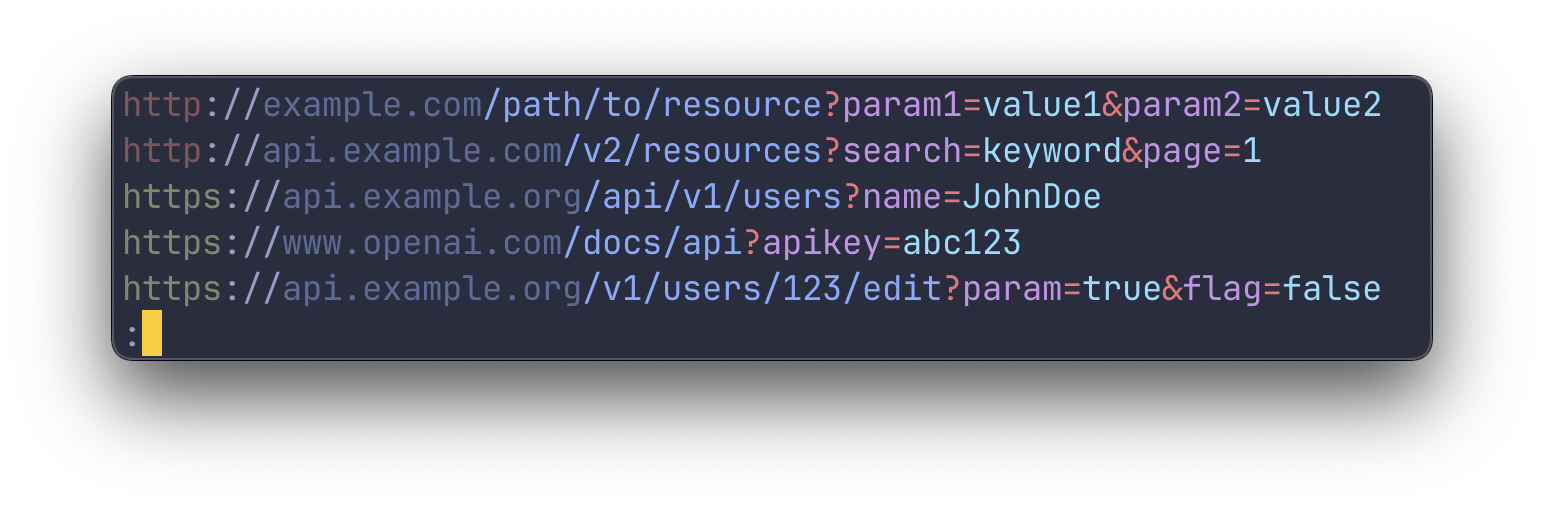
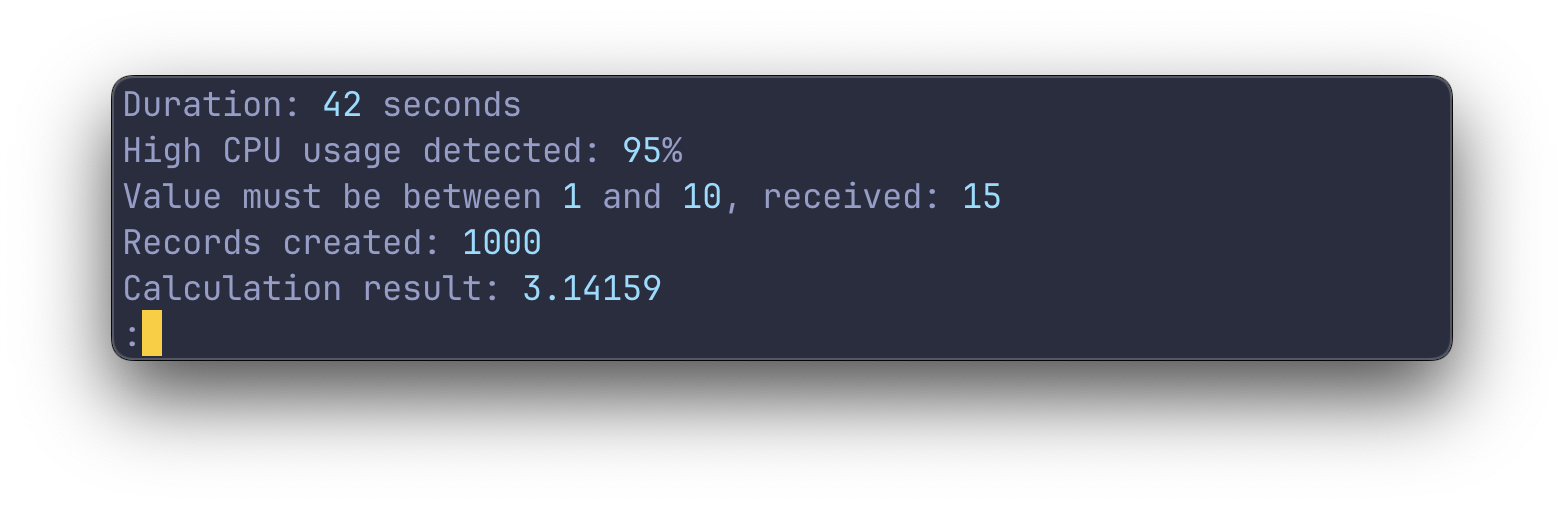
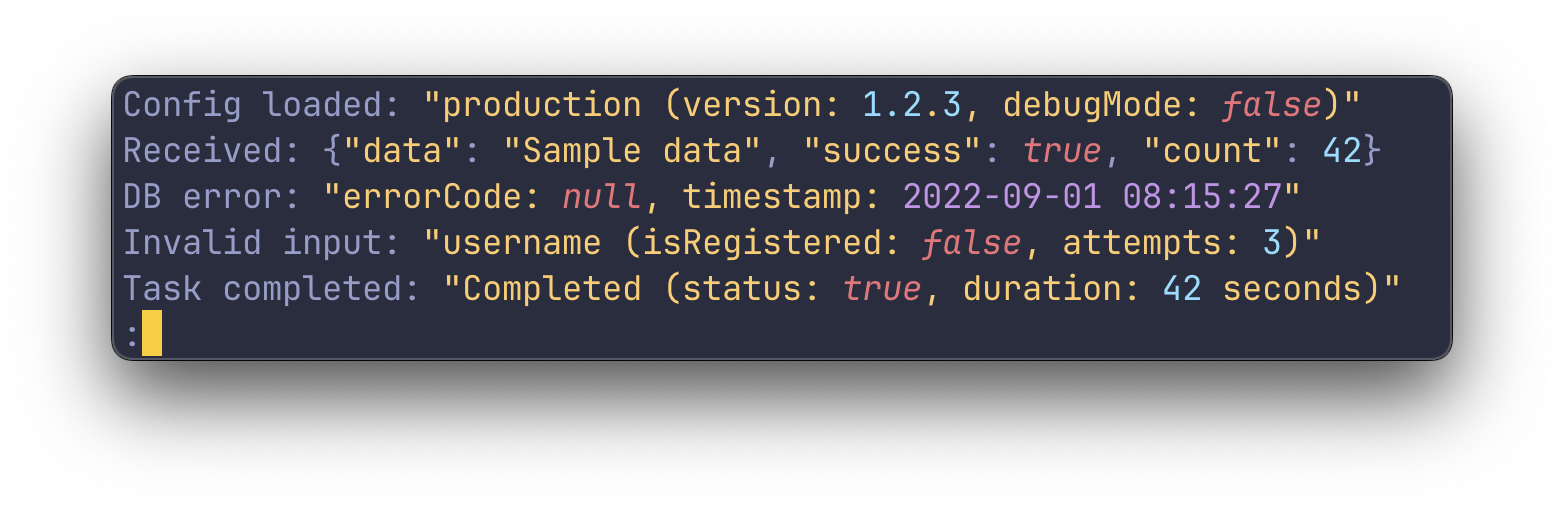
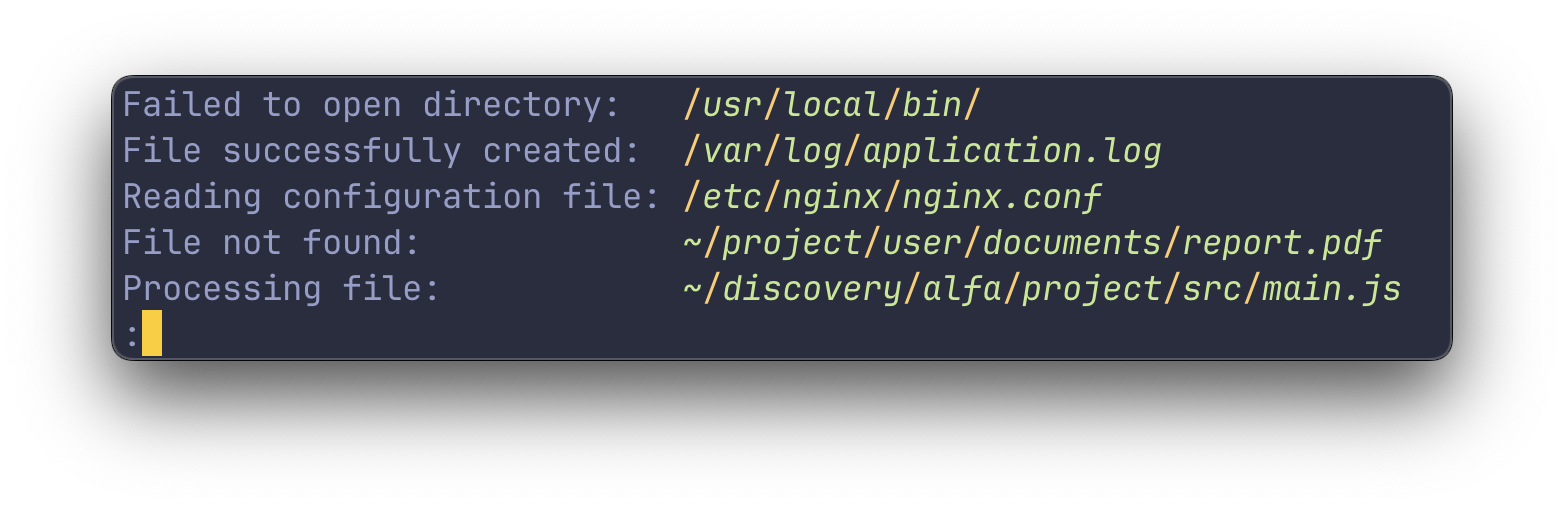
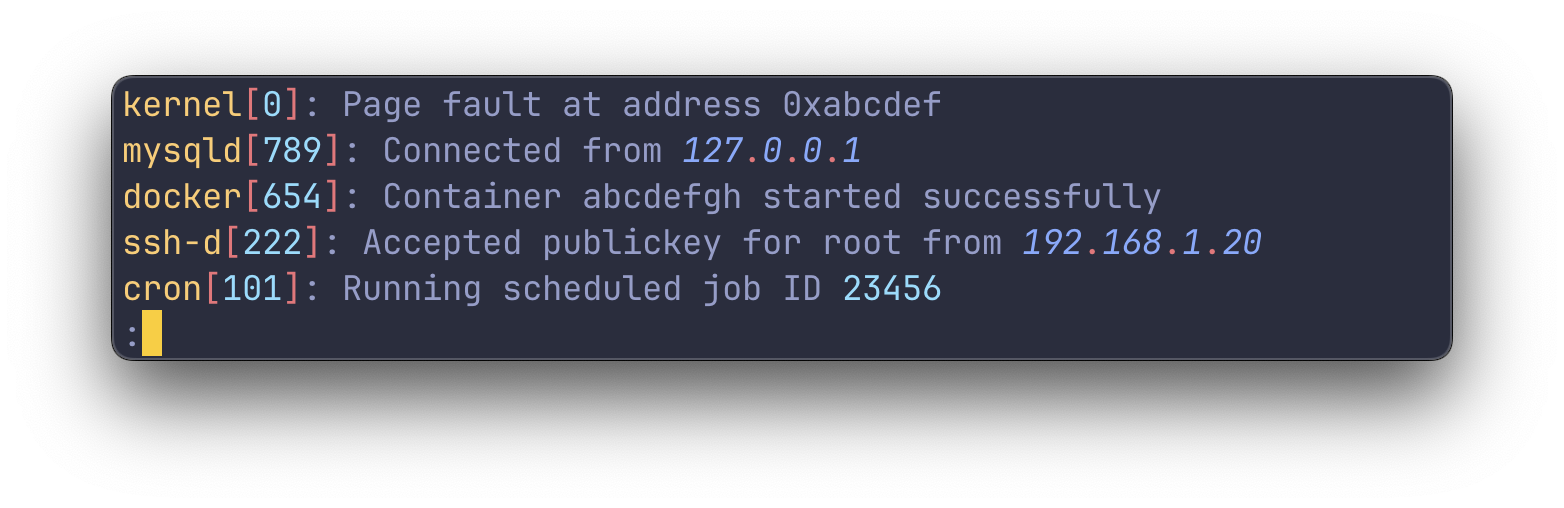
The following highlight groups are enabled by default and can be toggled with --enable and --disable. The
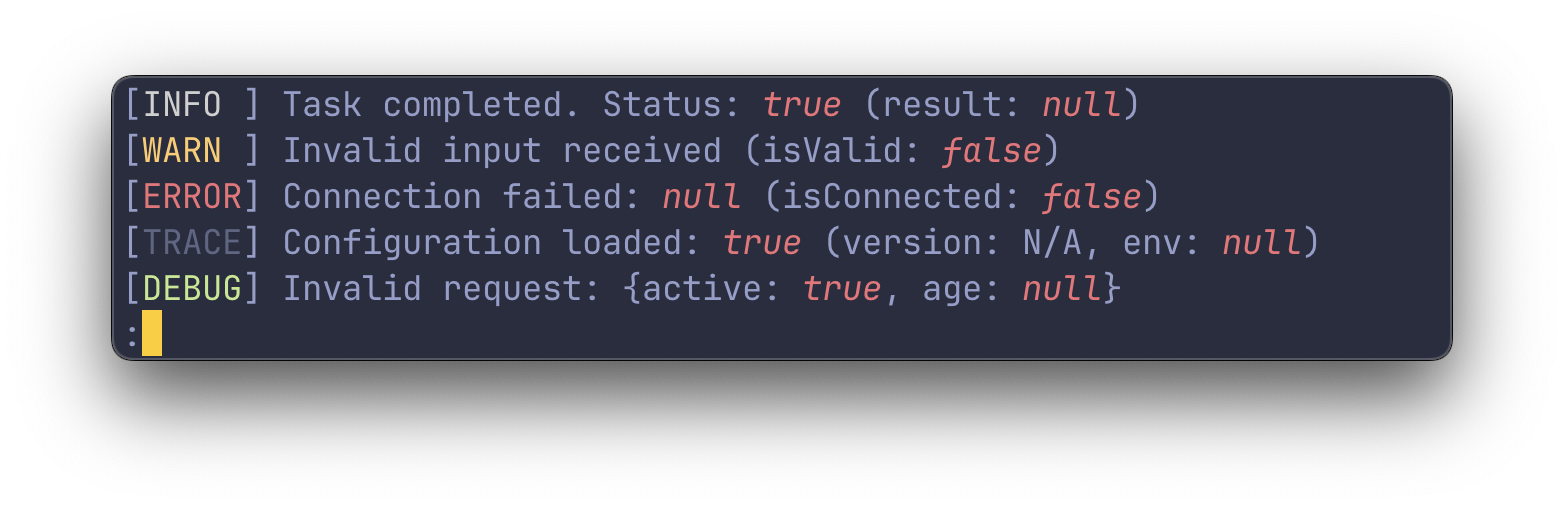
keywords group covers the builtin keywords: log severities, booleans, nulls and the HTTP methods.
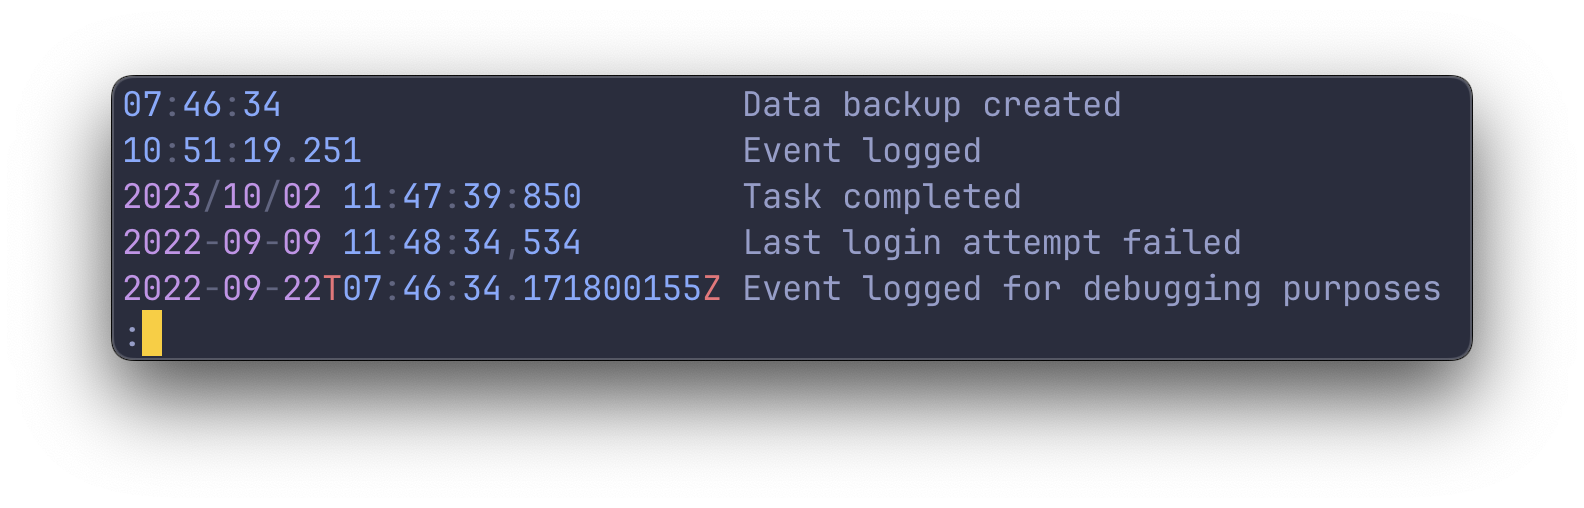
Dates
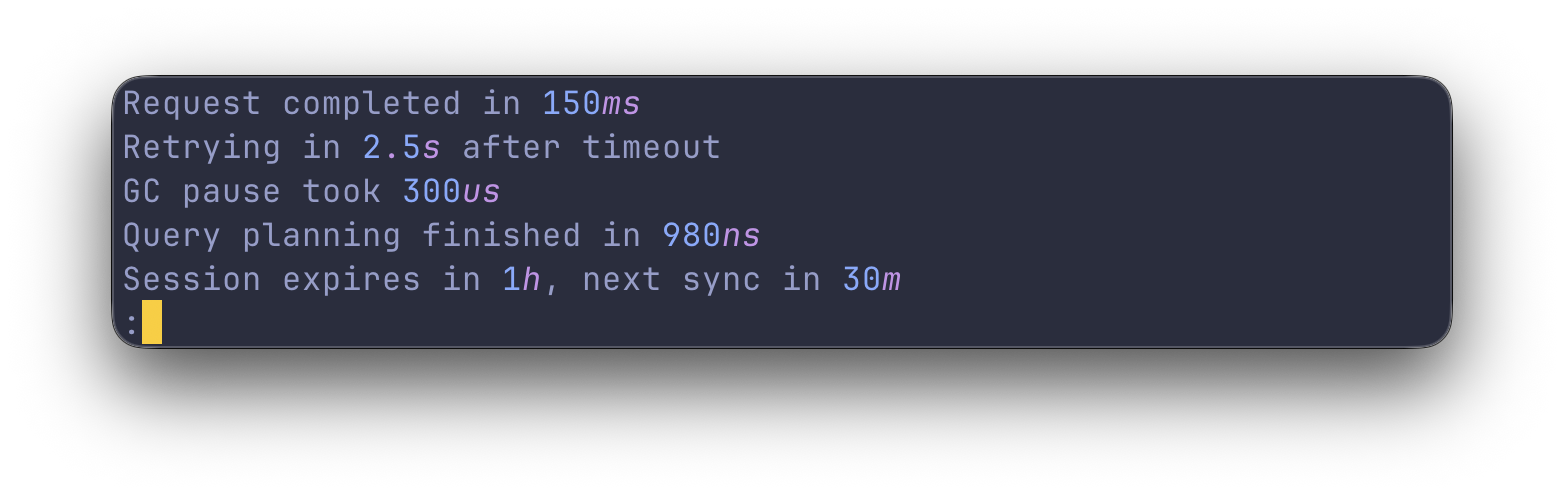
Durations
Keywords
URLs
Numbers
IPv4 Addresses

Quotes
Unix file paths
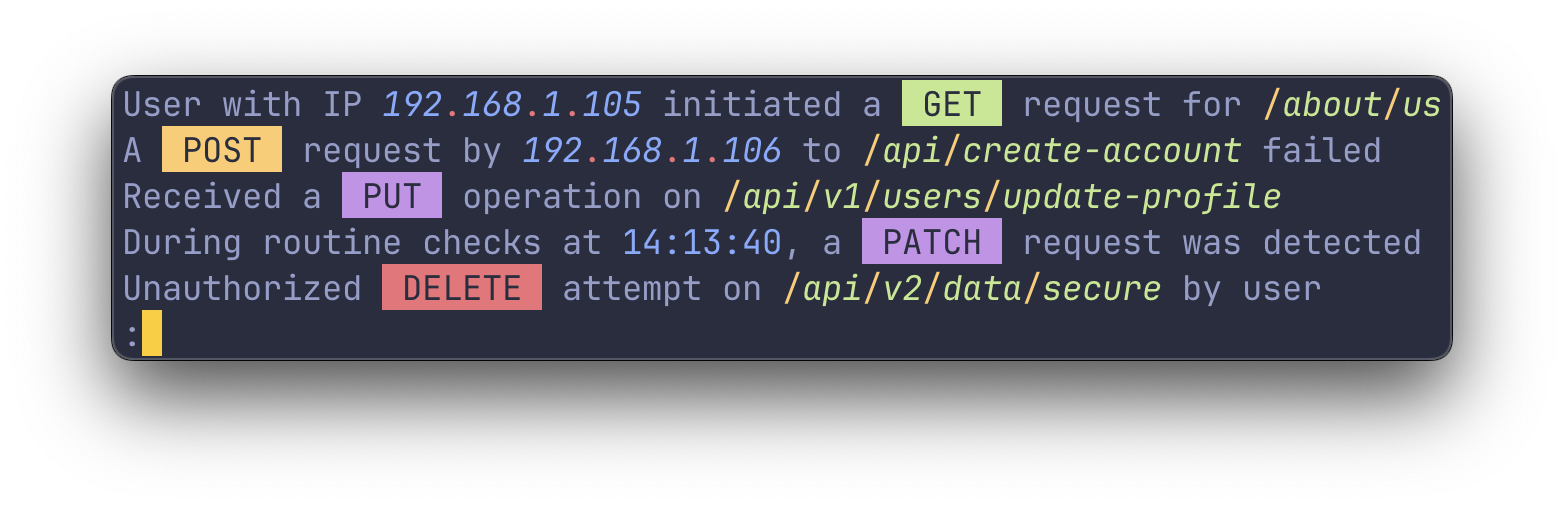
HTTP methods
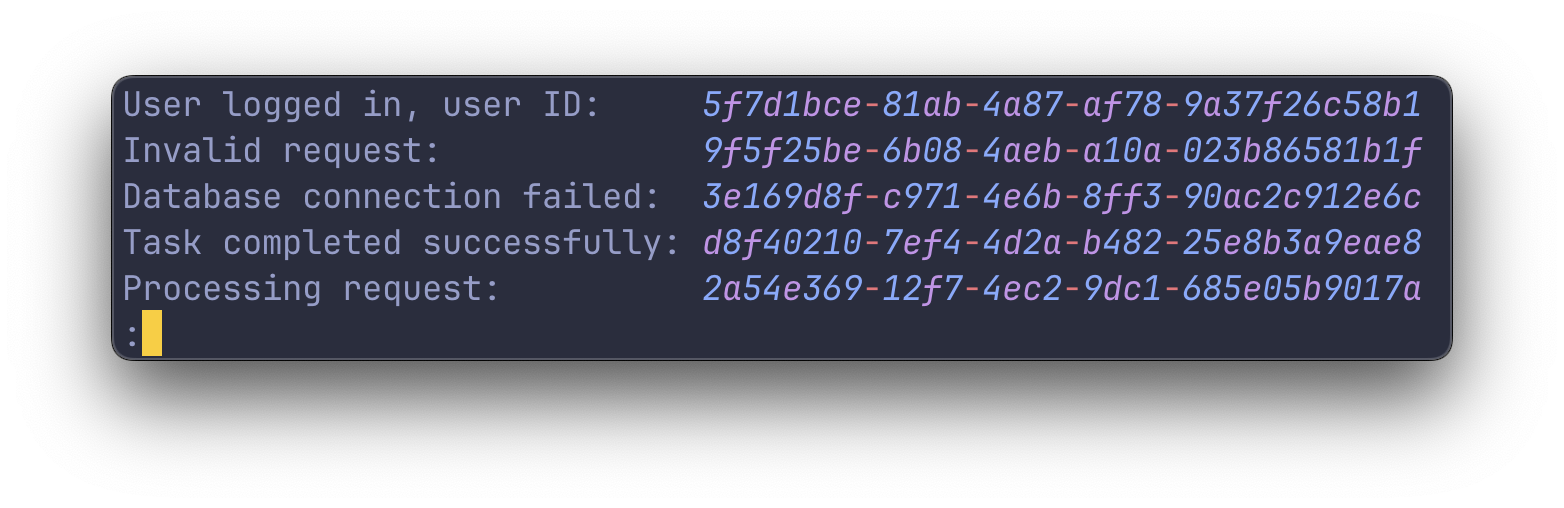
UUIDs
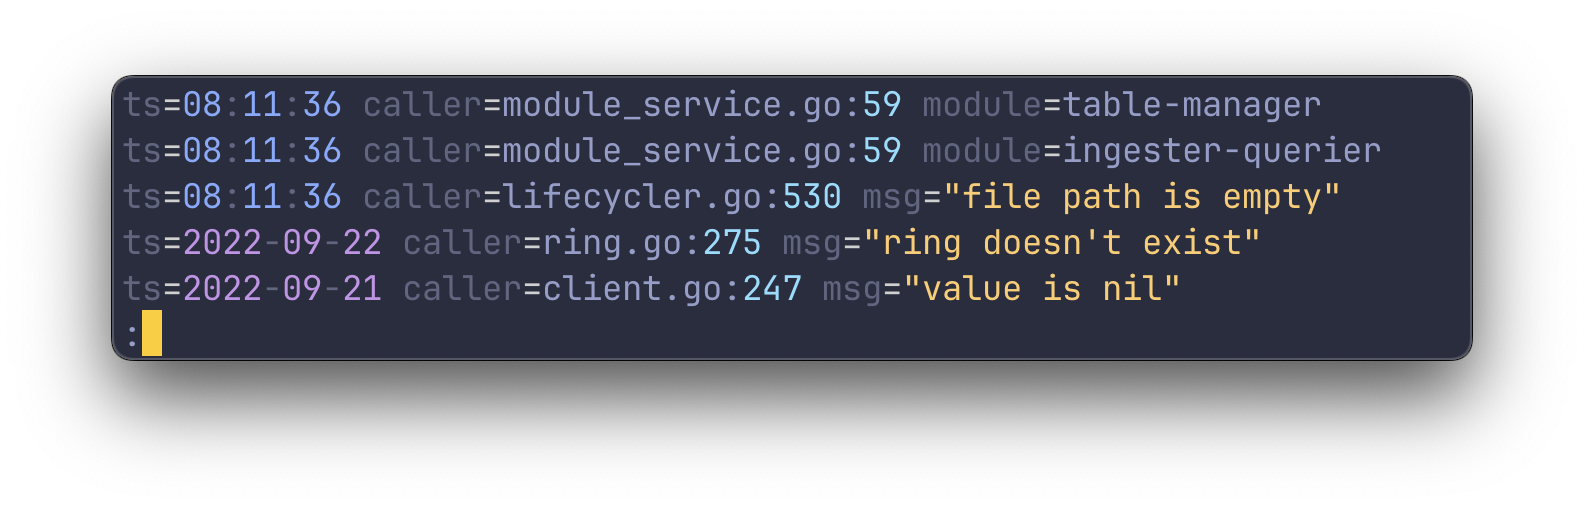
Key-value pairs
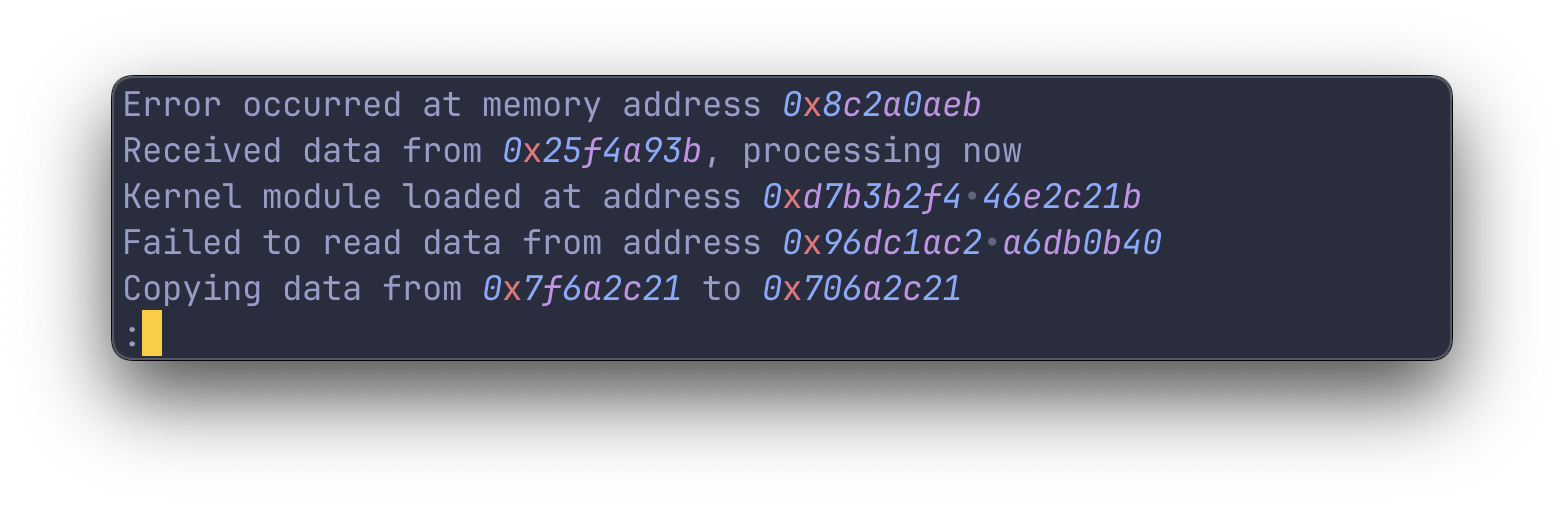
Pointer addresses
Unix processes
Extras are highlight groups that are not enabled by default. They can be enabled with the --extras flag and are
always additive — they apply on top of whatever defaults or --enable/--disable configuration is active.
# Enable IPv6 highlighting in addition to the defaults
tspin application.log --extras ipv6

# Combine with --enable
tspin application.log --enable urls,numbers --extras ipv6
Available extras:
| Name | Description |
|---|
ipv6 | Highlight IPv6 addresses |
jvm-stack-trace | Highlight JVM stack traces (Java, Kotlin, Scala, etc.) |
To enable extras by default without passing the flag every time, set the TAILSPIN_EXTRAS environment variable
(comma-separated):
export TAILSPIN_EXTRAS=jvm-stack-trace
Customizing Highlight Groups
Overview
Create a theme.toml in ~/.config/tailspin (on Windows: %APPDATA%\tailspin) to customize highlight groups.
Styles have the following shape:
style = { fg = "color", bg = "color", italic = false, bold = false, underline = false }
To edit the different highlight groups, include them in your theme.toml file. For example, to edit the date
highlight group, add the following to your theme.toml:
[dates]
date = { fg = "green" }
The default style of every highlight group is listed in default-theme.toml. The file is
generated from the code, so it is always in sync with the actual defaults — copy it to
~/.config/tailspin/theme.toml and edit the styles you want to change, or generate it locally:
tspin --generate-default-theme > ~/.config/tailspin/theme.toml
To load a theme from a different location, use the --theme flag or the TAILSPIN_THEME environment variable.
Disabling Highlight Groups
To individually disable or enable default highlight groups, use the --enable and --disable flags:
# Enable only the url highlight group, disable the rest
tspin application.log --enable urls

# Disable the numbers highlight group, keep the rest
tspin application.log --disable numbers
Adding Keywords via theme.toml
To add custom keywords, either include them in the list of keywords or add new entries:
[[keywords]]
words = ['MyCustomKeyword']
style = { fg = "green" }

[[keywords]]
words = ['null', 'true', 'false']
style = { fg = "red", italic = true }
Adding Keywords from the command line
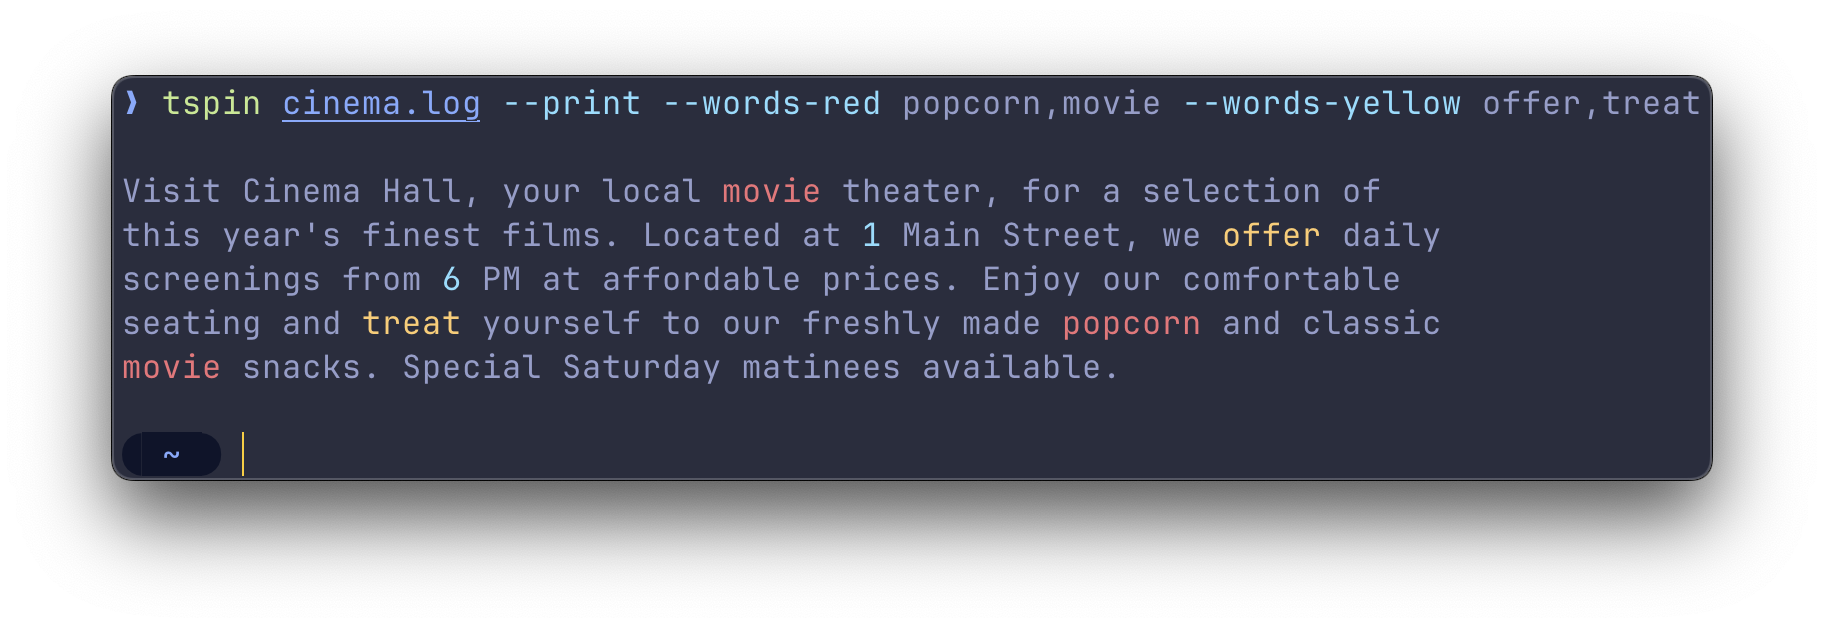
Sometimes it is more convenient to add highlight groups on the fly without having to edit a TOML. To add highlights from
the command line, use the --highlight flag followed by a comma separated list of words to be highlighted.
For example:
tspin --highlight=red:error,fail --highlight=green:success,ok
Custom regex highlighters
When you need more control over the highlighting, you can use the regex highlighter. This highlighter allows you to
specify a regex and a style to be applied to the matched text.
It supports one capture group (). When found, it will apply the style to the captured text.
[[regexes]]
regex = 'Started (.*)\.'
style = { fg = "red" }
Working with stdin and stdout
Default behavior with pipes
By default, tailspin will open a file in the pager less. However, if you pipe something into tailspin, it will
print the highlighted output directly to stdout. This is similar to running tspin [file] --print.
To let tailspin highlight the logs of different commands, you can pipe the output of those commands into tailspin
like so:
journalctl -f | tspin
cat /var/log/syslog | tspin
kubectl logs -f pod_name | tspin
Capturing the output of a command and viewing it in less
To capture the output of a command and view it in less, use the --exec flag:
tspin --exec 'kubectl logs -f pod_name'
This will run the command kubectl logs -f pod_name in the background and pipe the output to tailspin. The output
will be displayed in less, allowing you to navigate and search through the logs.
Overview
tailspin uses less as its pager to view the highlighted log files. You can get more info on less via the man
command (man less) or by hitting the h button to access the help screen.
Navigating
Navigating within less uses a set of keybindings that may be familiar to users of vim or other vi-like
editors. Here's a brief overview of the most useful navigation commands:
- j/k: Scroll one line up / down
- d/u: Scroll one half-page up / down
- g/G: Go to the top / bottom of the file
Follow mode
When you run tailspin with the -f or --follow flag, it will scroll to the bottom and print new lines to the screen
as they're added to the file.
To stop following the file, interrupt with Ctrl + C. This will stop the tailing, but keep the
file open, allowing you to review the existing content.
To resume following the file from within less, press Shift + F.
Search
Use / followed by your search query. For example, /ERROR finds the first occurrence of
ERROR.
After the search, n finds the next instance, and N finds the previous instance.
Filtering
less allows filtering lines by a keyword, using & followed by the pattern. For instance, &ERROR shows
only lines with ERROR.
To only show lines containing either ERROR or WARN, use a regular expression: &\(ERROR\|WARN\).
To clear the filter, use & with no pattern.
Set the TAILSPIN_PAGER environment variable to override the default pager.
The command must include the string [FILE] which will be replaced with the file path internally.
For example:
TAILSPIN_PAGER="ov -f [FILE]" tspin example-logs/example1
Settings
-f, --follow                     Follow the contents of the file
-p, --print                      Print the output to stdout
-e, --exec='[CMD]'               Run command and view the output in a pager
                                 (e.g. `tspin --exec 'kubectl logs -f pod_name'`)
    --theme=[PATH]               Use the theme file from the provided path
    --pager=[CUSTOM_PAGER]       Set a custom pager
                                 (e.g. `--pager="ov -f [FILE]"`)
    --highlight=[COLOR]:[WORDS]  Highlight the provided comma-separated words in the specified color
                                 (e.g. `--highlight red:ERROR,WARNING`)
    --enable [HIGHLIGHT_GROUP]   Enable one or more default highlight groups, disabling the rest
                                 (e.g. `--enable keywords,urls`)
    --disable [HIGHLIGHT_GROUP]  Disable one or more default highlight groups, enabling the rest
                                 (e.g. `--disable keywords,urls`)
    --extras [EXTRA]             Enable extra highlight groups on top of the current configuration
                                 (e.g. `--extras ipv6`)
    --completions [SHELL]        Print shell completions to stdout
                                 (e.g. `--completions zsh`)
    --generate-default-theme     Print the default theme as a theme.toml to stdout