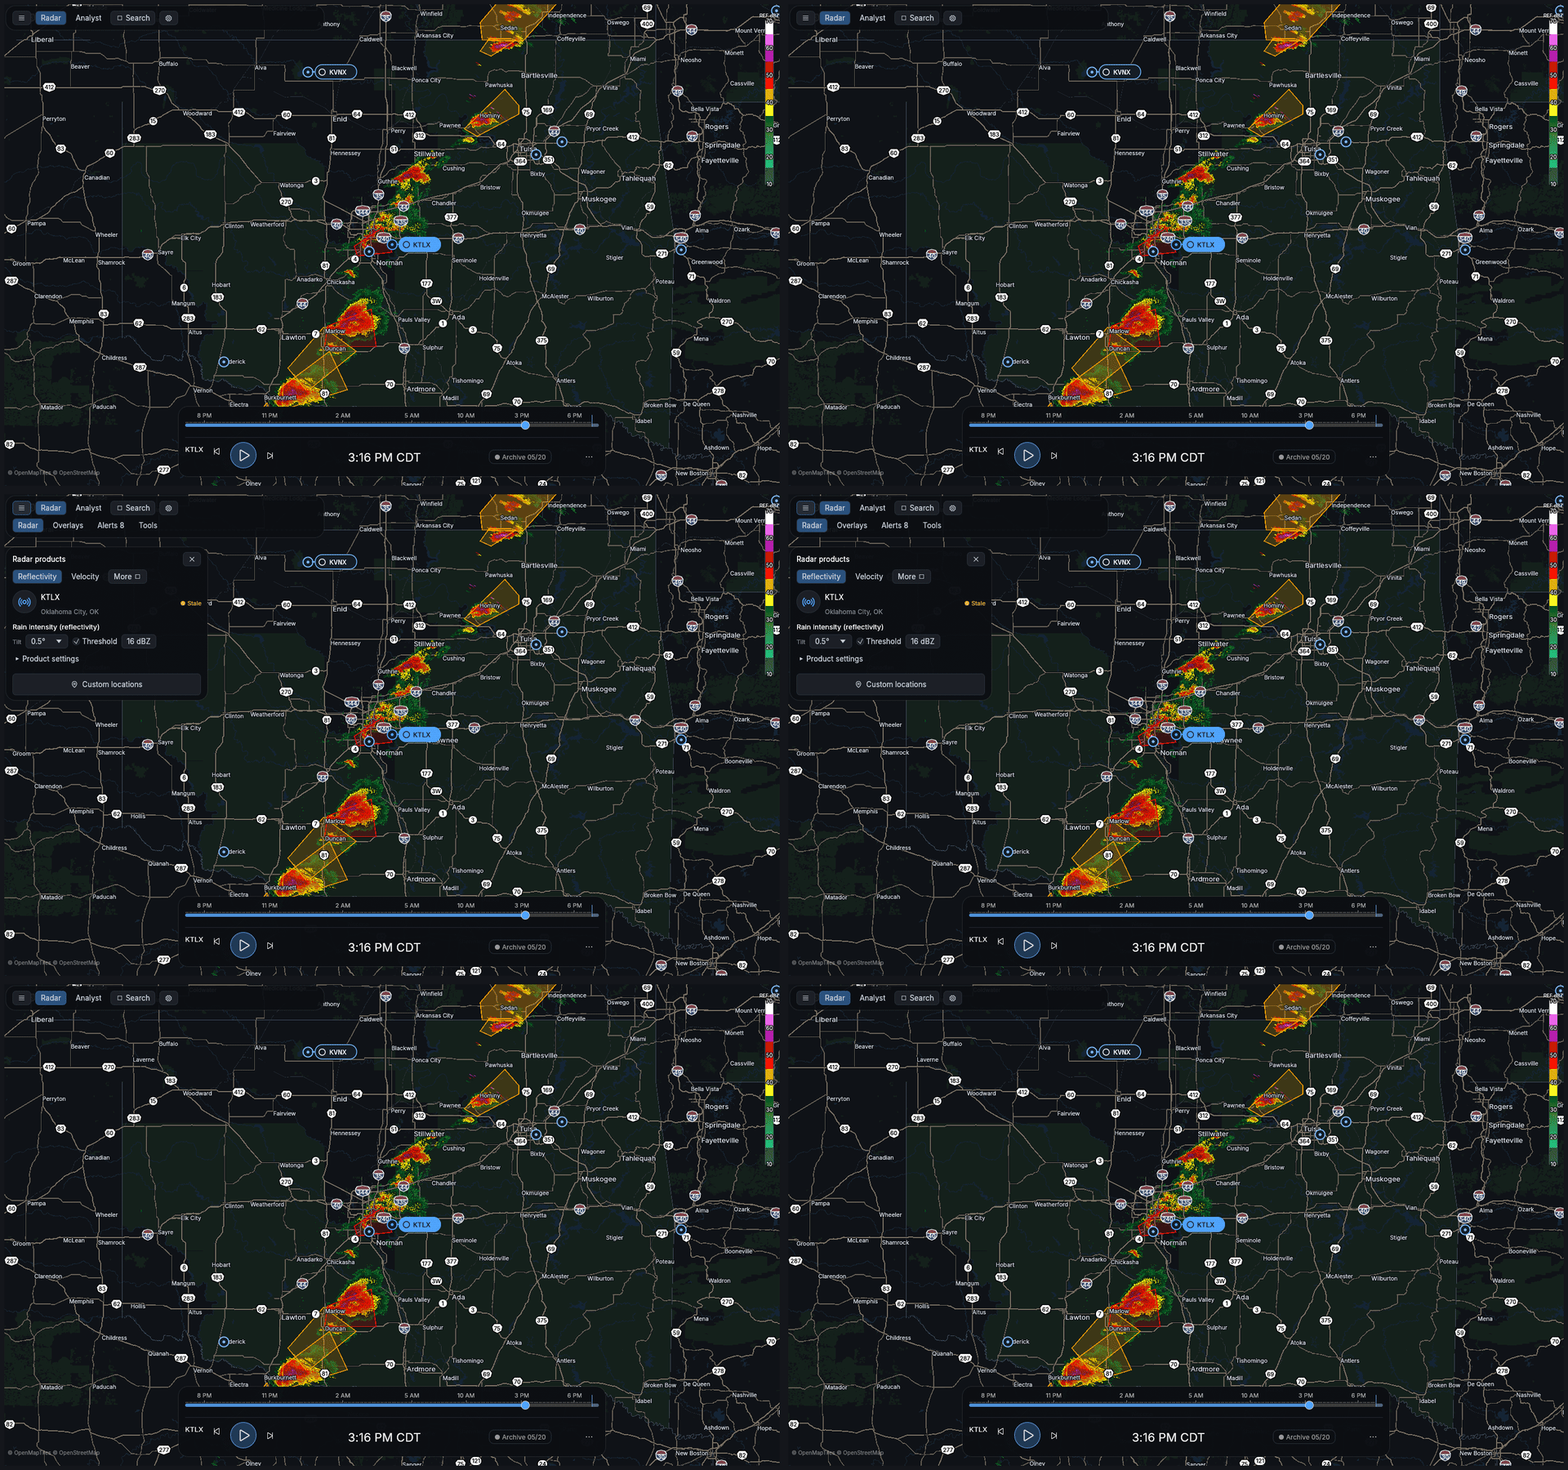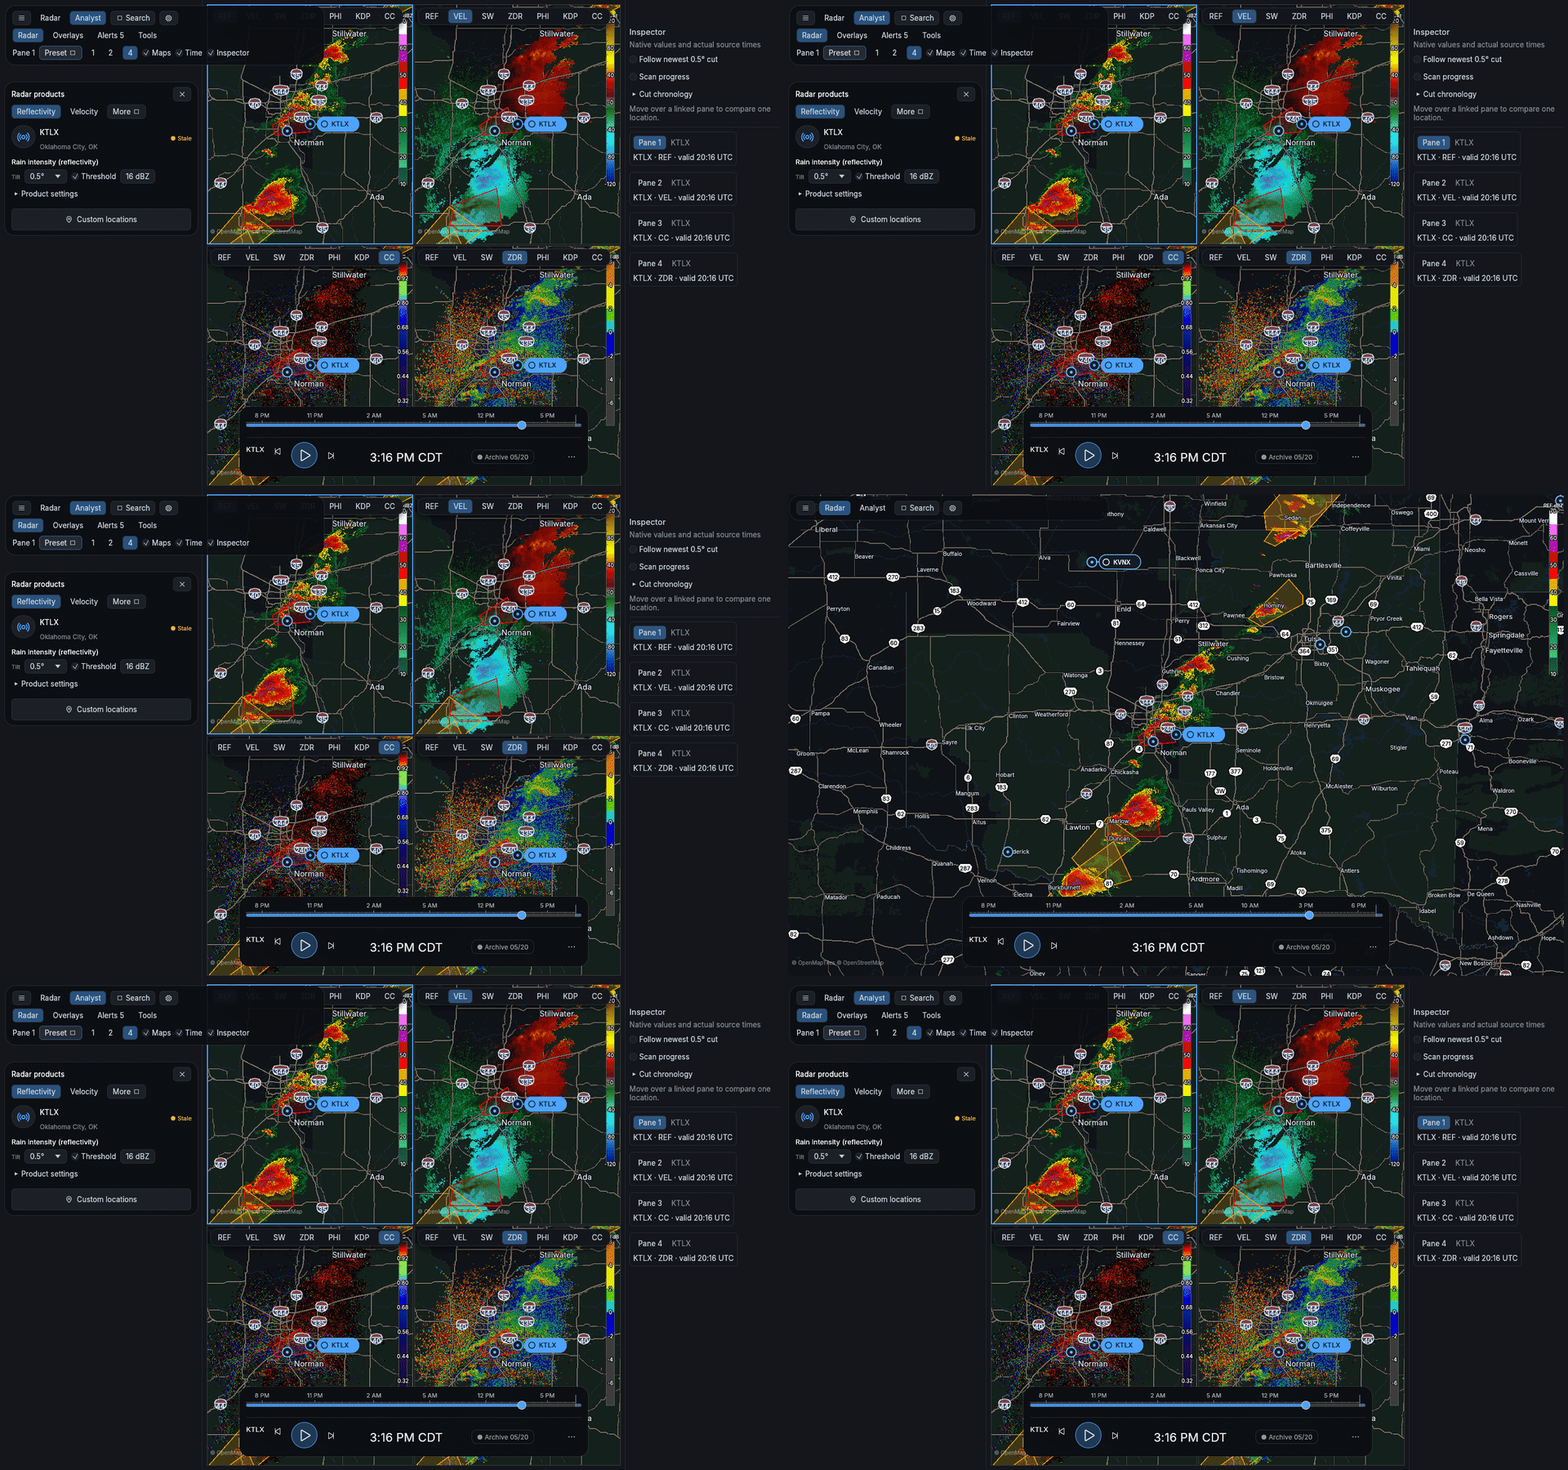
Advanced NEXRAD weather radar viewer — an open-source homage to supercell-wx, built from scratch in Rust with wgpu + egui. Deep per-site Level 2 / Level 3 analysis plus national situational awareness, forecast environment overlays, and warning intelligence — on Windows, Linux, and Android.
README
Hook Echo-WX
Advanced NEXRAD weather radar viewer — an open-source homage to
supercell-wx, built from scratch in Rust
with wgpu + egui. Deep per-site Level 2 / Level 3 analysis plus national
situational awareness, forecast environment overlays, and warning intelligence —
on Windows, Linux, and Android.
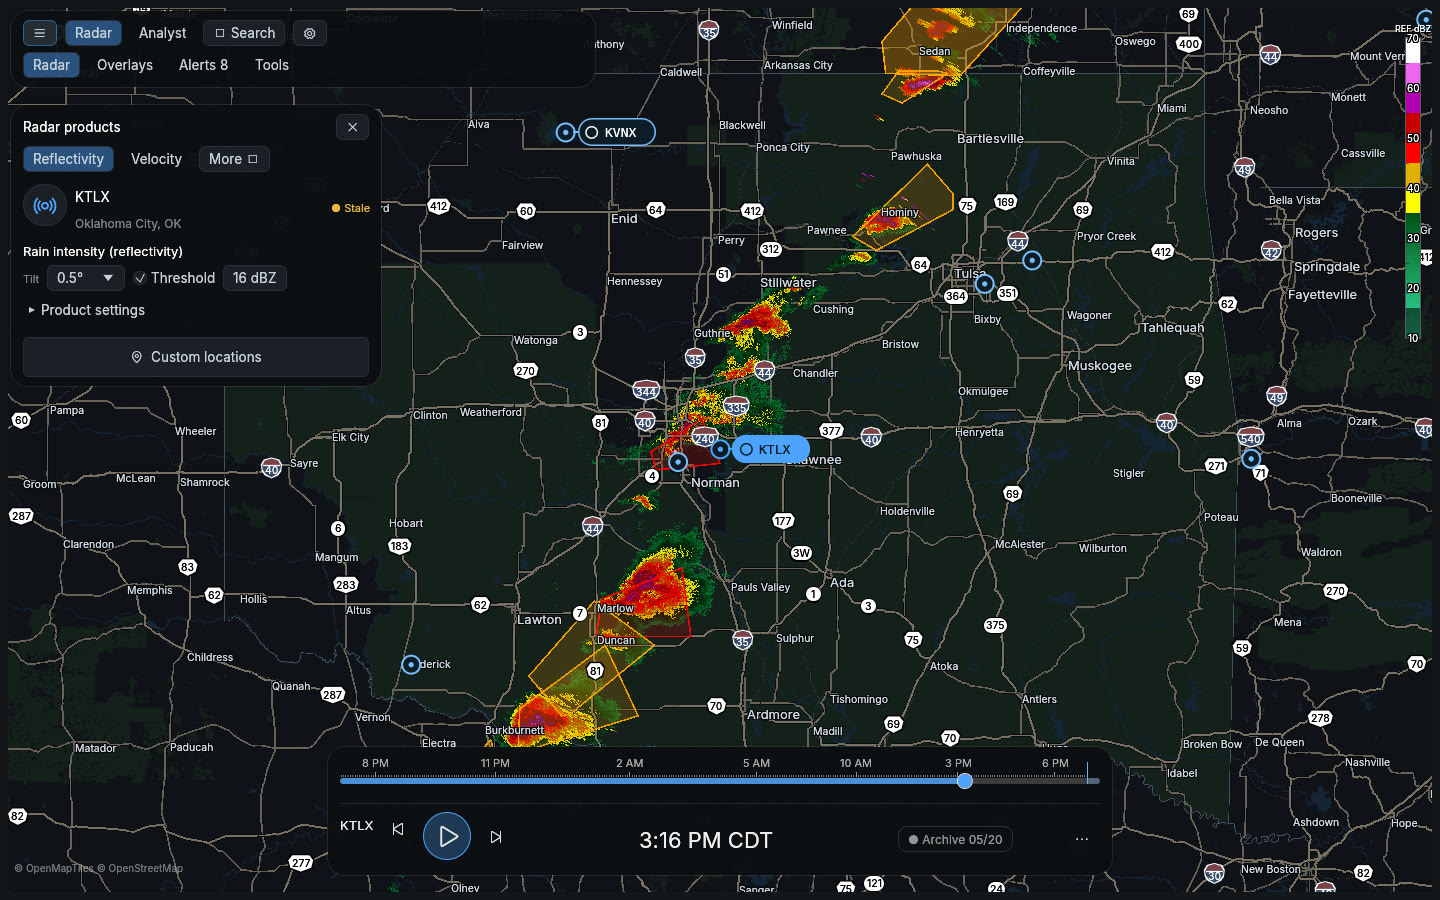
KTLX 0.5° reflectivity — Moore, Oklahoma, 20 May 2013. Replayed from the
public archive inside the app, one scan every few seconds, with the tornado
warning that was in force at the time.
Animated wind. HRRR 10 m wind as drifting particles coloured by speed —
built from NOAA's free GRIB grids, so it needs no API key.
Install
Linux: download Hook_Echo-WX-x86_64.AppImage from
Releases, chmod +x, run.
Windows: grab the installer from Releases —
Hook_Echo-WX-setup-x86_64.exe (setup wizard) or Hook_Echo-WX-x86_64.msi
(MSI, for scripted/enterprise installs). A portable
hookecho-windows-x86_64.zip is there too: unzip, run hookecho.exe.
Android (arm64, Android 10+): sideload Hook_Echo-WX-arm64-v8a.apk from
Releases (adb install -r …, or open it on-device with
"install unknown apps" enabled). The same Rust app as desktop,
with a Material 3 phone UI — see .
From source: cargo run --release (needs a Rust toolchain; on Linux also
ALSA/Wayland/GTK dev headers — see .github/workflows/ci.yml). Android builds
via android/build.sh (NDK + cargo-ndk).
Versioned v* releases are the stable channel. Every push to main also
refreshes a latest rolling prerelease carrying the
same five artifacts, if you want the newest work without waiting for a tag.
First launch opens a setup wizard: pick your home radar site, a theme (13 built
in), and how warnings should reach you (chime and/or ntfy.sh
push to your phone). After that, three one-time callouts point at the controls
you'll actually use. Re-run the wizard anytime from the sidebar's App → Setup wizard.
The interface
Hook Echo-WX is a map with its controls docked around it — no menu bar, no
floating cards over the weather:
The left sidebar holds everything: the site, the current product and its
tilt, the expert knobs for that product, then every layer, window and tool —
one icon-led row each, described in plain English, filed under collapsible
categories that carry their own count, with the layer options, map settings and
app commands under them. Search it with Ctrl+K; Enter runs the top match.
Drag a row by its icon to pin it above the rest of its category, and collapse
the whole sidebar to a single button when you want the map and nothing else.
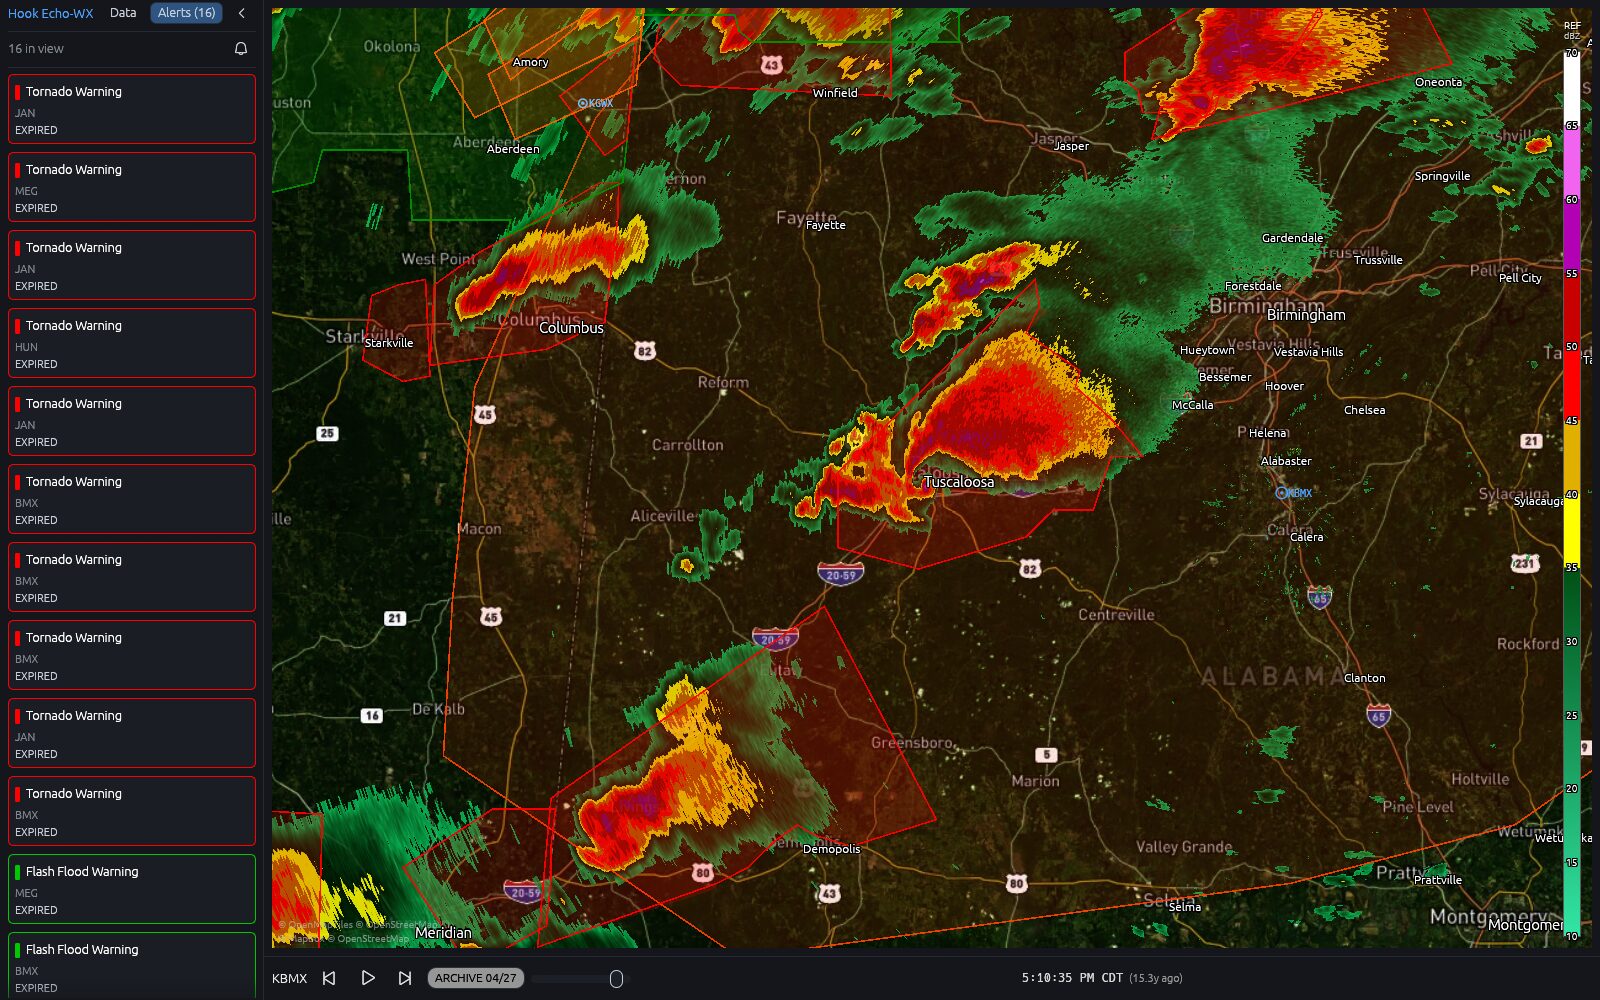
Its Alerts tab lists every alert covering your view, worst first, badged
with the count. Click a row to fly there and read the bulletin.
The bottom bar is the timeline: site, clock, play, scrub, and a LIVE badge
that snaps back to the newest scan. Right-click the badge for the archive day,
loop and playback speed.
The right edge carries the color scale for the product each pane is
showing — a thin bar floating over the map, spanning only the values the color
table actually paints.
That's the whole of it. Searching for a place is the same box — type a name and
take the Fly to row at the bottom of the results.
Search everything
One sidebar for everything
Joplin, MO — 22 May 2011
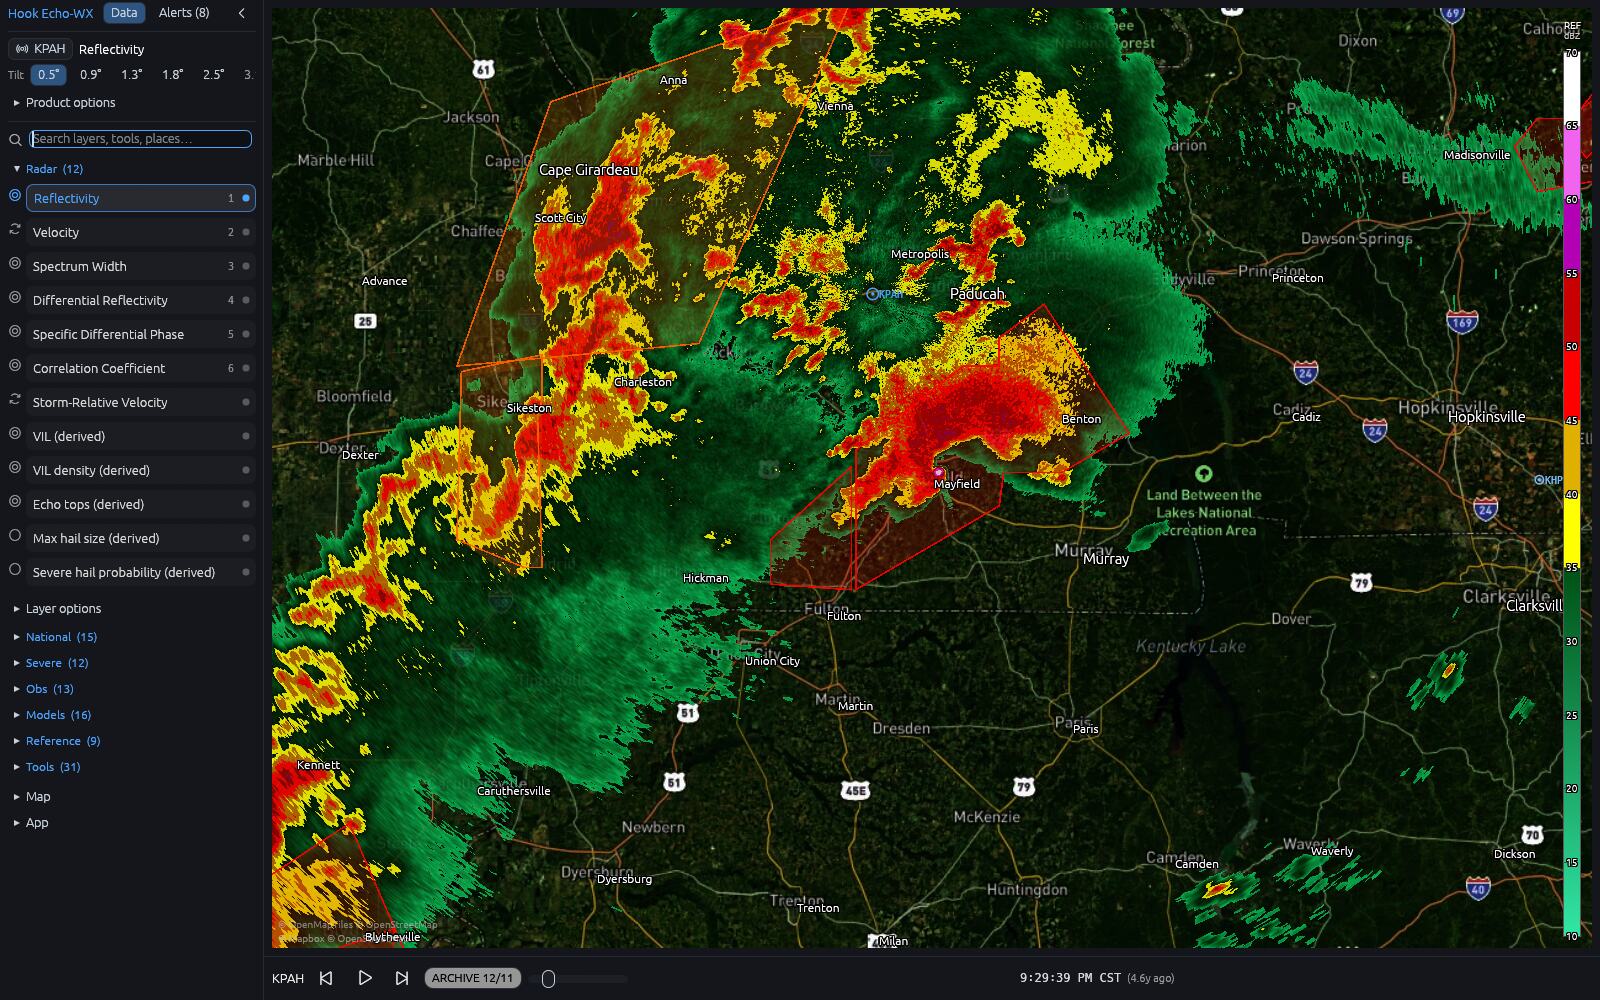
Mayfield, KY — 11 Dec 2021
Radar times read in the selected radar's local time, not Zulu — a KEPZ pane
shows MDT while a KTLX pane shows CDT, side by side. Settings → Units puts it
back to UTC if you'd rather work in Zulu.
Every expert control is still there, in the sidebar's Layer options section,
which shows a layer's settings only once that layer is on — so the forecast-hour
slider appears when you turn on future radar, and stays out of the way when you
haven't.
Search a place in the sidebar and it flies there, with a Save marker button
if you want to keep it. Markers are what the warning, lightning and rain-arrival
alerts watch. Tap one on the map to rename or remove it.
Walkthrough
Storm screenshots are historic events replayed through the app's own archive
timeline — the same scrubbing you'd do live. Forecast and national layers are
live data, captured as they came in. Everything is on the Mapbox Satellite
Streets basemap; a dozen others ship too, from a dark vector map to GOES
satellite imagery.
Watching a storm
All six Level 2 moments on a GPU polar pipeline, with VCP-aware tilt selection,
velocity dealiasing, storm-relative velocity, and GRLevelX .pal color tables.
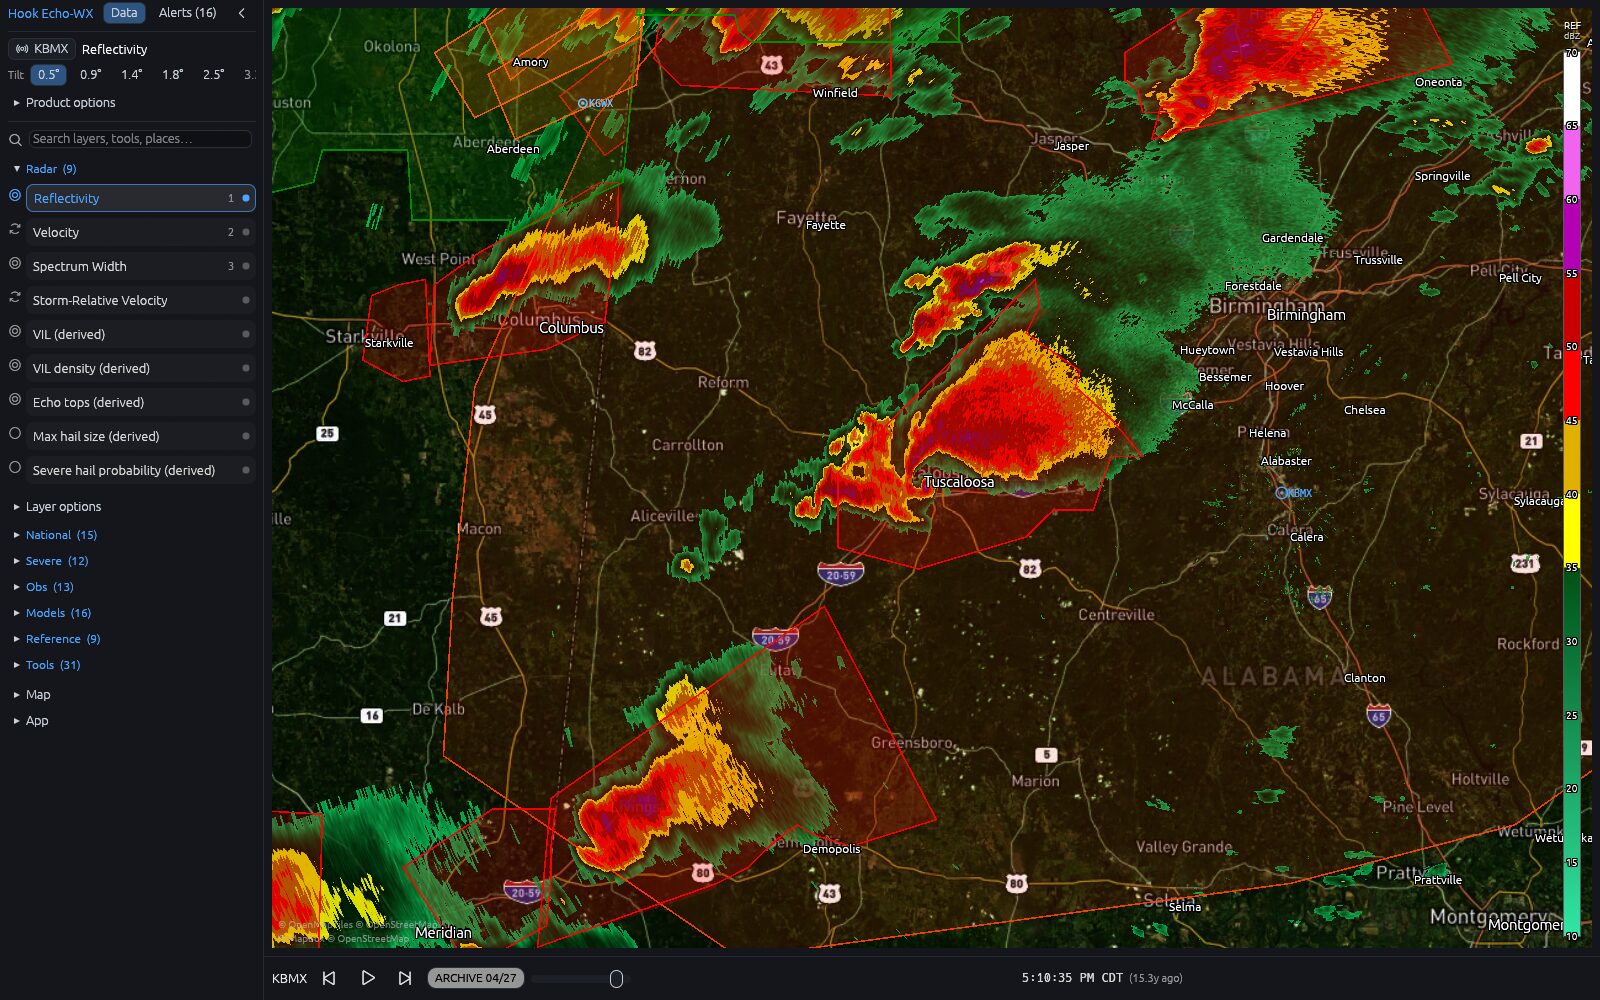
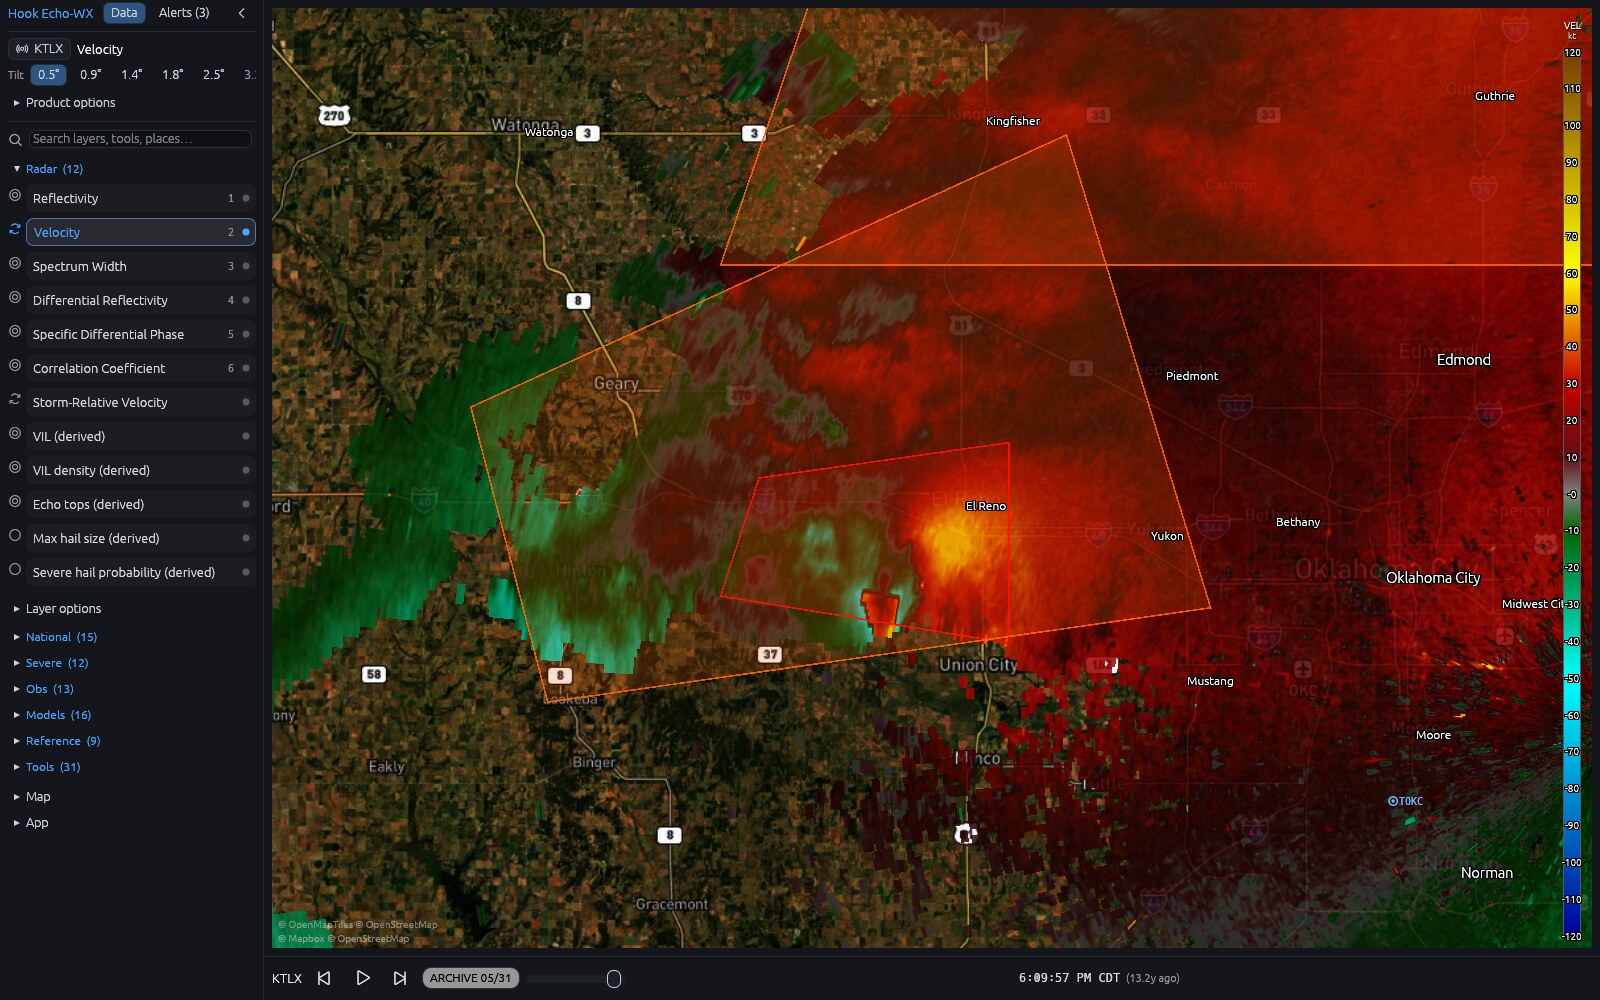
Reflectivity shows you the storm's structure; velocity shows you what it's doing —
the tight red-against-green couplet below is a tornado on the ground.
Reflectivity
Velocity (dealiased)
KBMX — Tuscaloosa, AL, 27 Apr 2011
KTLX — El Reno, OK, 31 May 2013
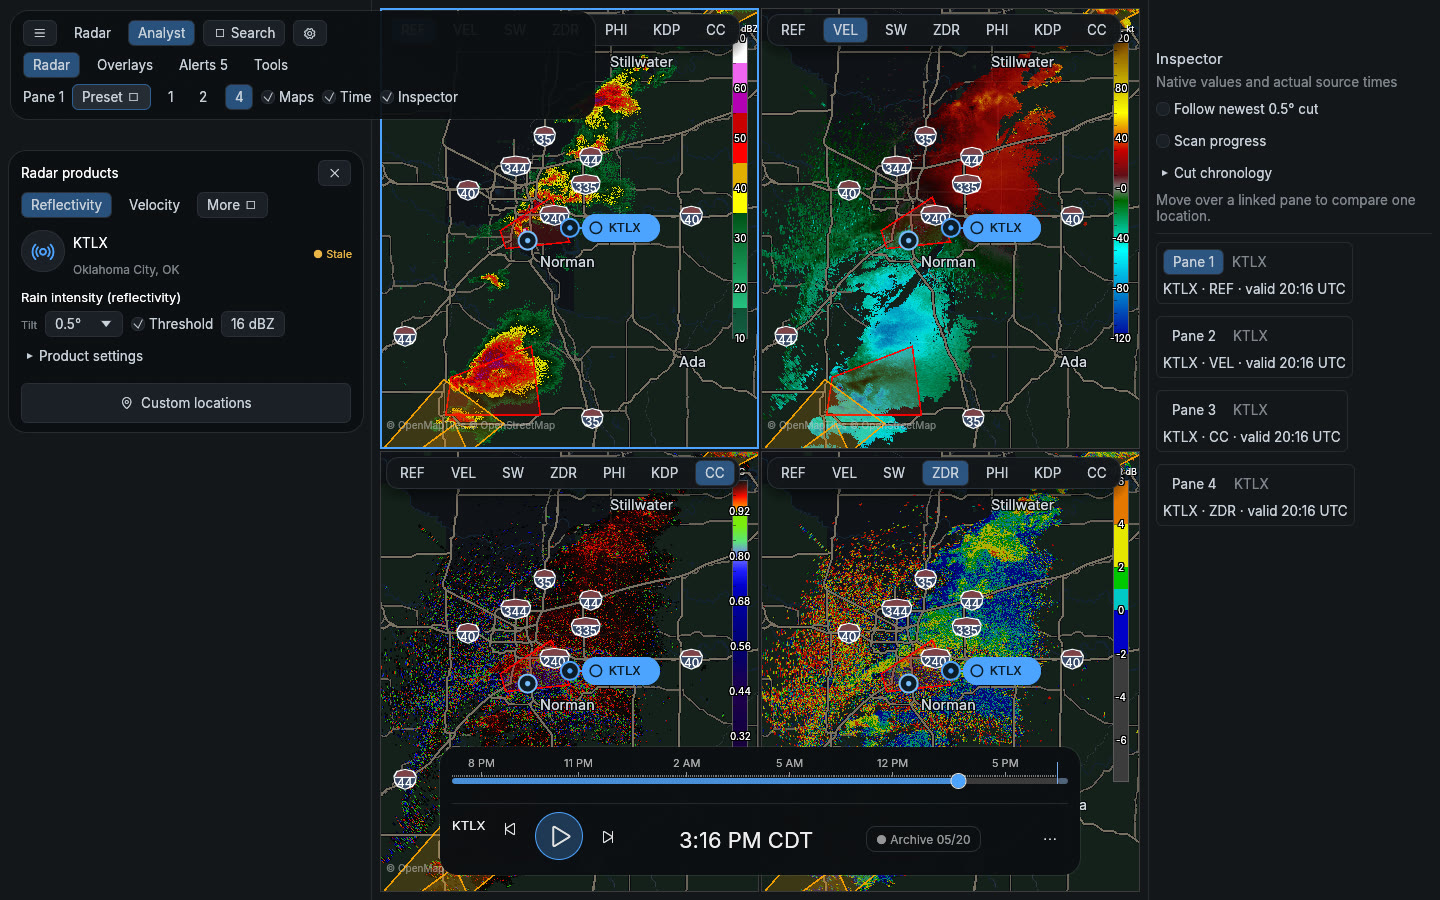
Split the window into four panes and give each one its own product, cameras
linked — reflectivity, velocity, correlation coefficient and differential
reflectivity on the same storm at the same second. One action does the same
trick with four tilts instead, so you can see how a storm leans with height.
Cross-sections slice it vertically in any product — click two points and you get
the storm in profile, core and overhang and all.
Four products at once
Cross-section
KTLX — Moore, OK, 20 May 2013
Every screenshot in this section is a replay. The timeline reaches back to June
1991, so any archived storm loads the same way the live one does — a supercell
from fifteen years ago, or a hurricane coming ashore:
KTBW 0.5° reflectivity — Hurricane Ian, 28 September 2022.
And because the archive is there, you can ask how the warnings did. The
verification lab scores an office's warnings for a day against the storm reports
that came in — POD, FAR, CSI, lead times, and the individual rows behind them,
including the reports nobody warned for (the red dots on the map). The
arbitration is the Iowa Environmental Mesonet's, so the numbers agree with the
published ones instead of being a private opinion.
KTLX — 20 May 2013. OUN's warnings scored against that day's reports.
Deciding which storm matters
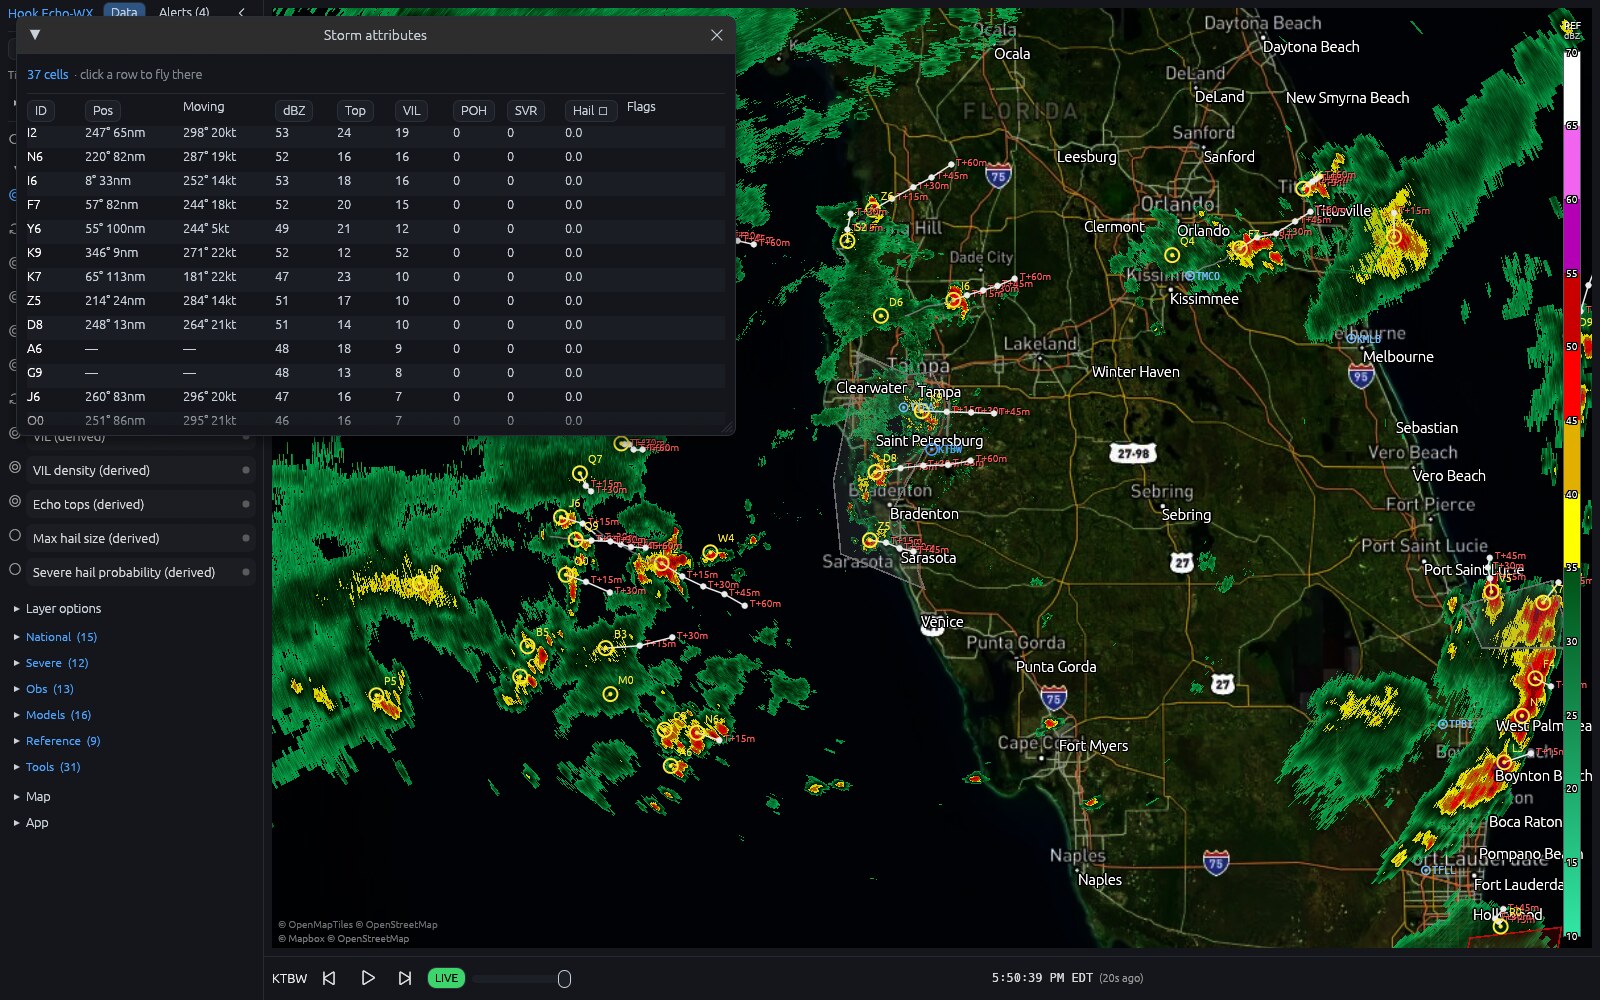
Every tracked cell in one sortable table — hail size, tops, VIL, rotation flags —
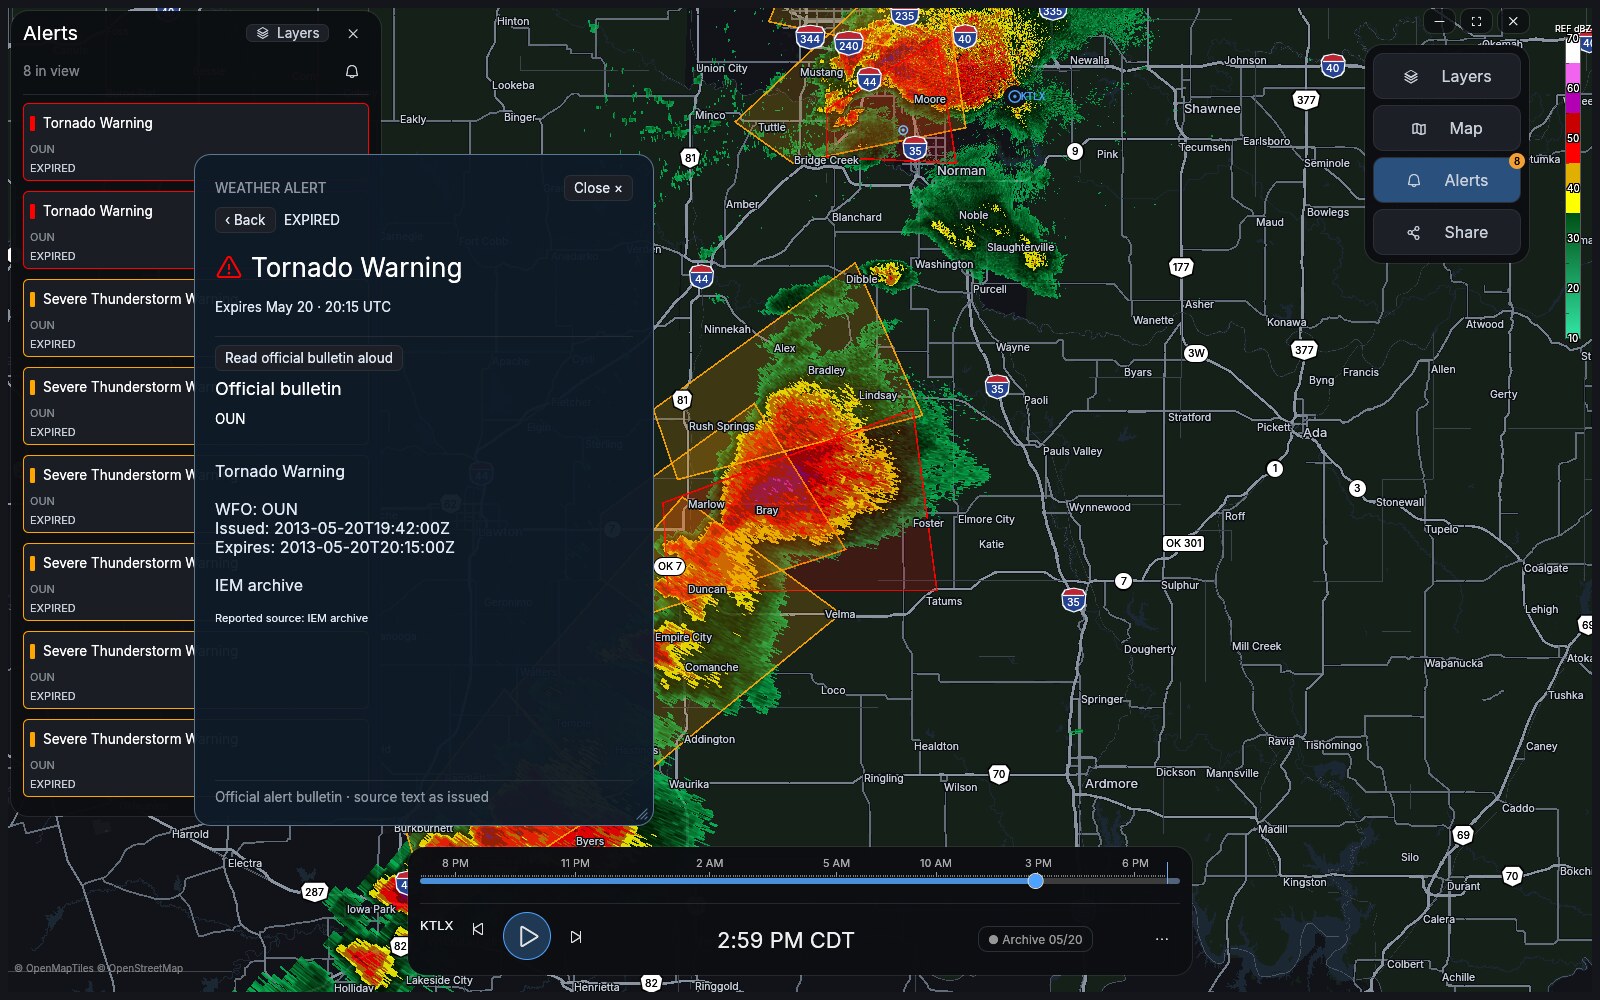
and clicking a row flies you there. Alongside it, an active-alerts panel sorted
worst-first, with clickable NWS bulletins and parsed storm-motion vectors. Scrub
into the archive and the panel fills with the warnings that were actually in
force at that moment.
Storm attributes
Active alerts
KTBW — live
KBMX — 27 Apr 2011 outbreak
Looking ahead
HRRR future radar rides the timeline's forecast tail, so scrubbing past the
present keeps going into the model. It is labeled the whole time it is on —
model output should never be mistaken for something a radar actually saw.
HRRR future radar, +1 h. The banner stays up for as long as the layer is
on: forecast, not observed.
Any point on the map gives you the plain NWS forecast for that spot, and the WPC
surface analysis draws the national weather map — fronts with their proper pips,
highs and lows with pressures.
Surface analysis
Point forecast
WPC coded surface analysis, live
Tap anywhere — KBMX, live
Also on the forecast tail: rotation tracks (HRRR max updraft-helicity swaths
— where storms are forecast to rotate, accumulated across the hours you scrub
to) and near-surface wildfire smoke.
The national picture
Every radar in the country stitched into one mosaic, updated every couple of
minutes — the view for "what's happening everywhere" rather than "what's
happening here" — plus rainfall accumulated over the last hour or day.
National mosaic
24-hour rainfall
MRMS composite reflectivity, live
MRMS gauge-corrected precipitation, live
There is also a multi-radar mosaic built the other way round: instead of a
national 1 km product, every radar covering your view contributes its own base
reflectivity at full resolution, composited nearest-radar-wins so neighbouring
sites join without a seam. It shows which radars it used and how old the oldest
scan in it is, because radars scan on their own schedules and a composite is
never one instant.
Six radars, one picture — live N0B composite
Alongside them: individual lightning flashes from the GOES satellite's lightning
mapper (fading as they age), cloud-to-ground lightning density, rotation tracks
and azimuthal shear, MESH hail size and 24-hour hail swaths, surface
precipitation type, and FLASH flash-flood recurrence intervals. Every gridded
layer draws its own scale and units.
Features
Warnings and alerting
Each warning's eventMotionDescription is parsed into a storm-motion vector —
warned-storm dot, projected 15/30/45/60-minute path, and ETA readouts to your
saved locations.
Home marker with a watch radius: mark one saved location as home and set
how close a warning has to come (20 miles by default) — you're alerted when
the polygon's edge reaches that ring, not only when it swallows your house.
Every marker carries its own radius; home draws its ring on the map.
Escalation tiers (CONSIDERABLE → DESTRUCTIVE/observed tornado → Tornado
Emergency / PDS) drive a pulsing polygon outline, priority sorting with red
threat chips, a dedicated emergency siren, and urgent-priority phone push.
Warnings are read aloud through the system voice — the desktop speech engine,
or Android's own TTS on the phone.
Watched-location monitoring, a lightning proximity alarm (a strike within
~15 km of a saved spot), rain-arrival alerts ("rain in about 20 minutes"), and
live NWS Local Storm Reports, minutes fresh.
Storm analysis
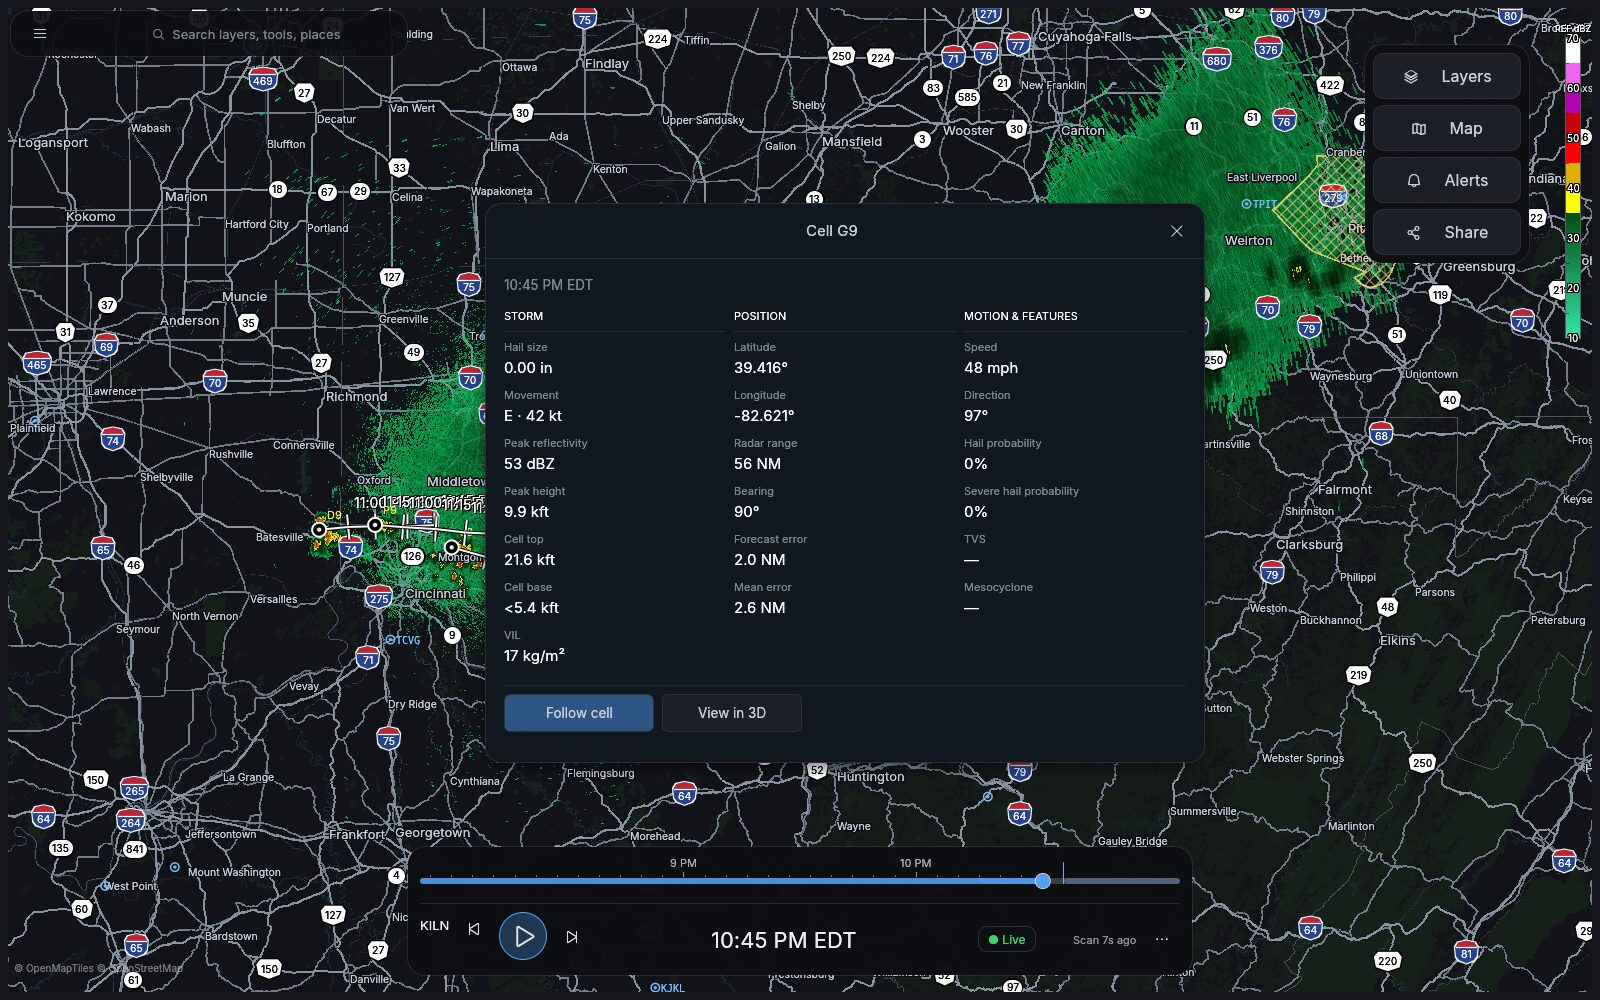
SCIT cell tracks, past tracks and arrival-time cones; hail and mesocyclone
flags; a sortable attributes table for every tracked cell at once.
Automatic tornado debris signature detection (low correlation coefficient
collocated with high reflectivity) and client-side azimuthal-shear couplet
detection on the live volume — a rotation flag that doesn't wait for a Level 3
product.
Cross-sections in any moment, a CAPPI altitude slicer, and a 3D volume view.
Environment and forecast
CAPE (surface-based or mixed-layer parcel) and storm-relative helicity (0–1 or
0–3 km) as map overlays, from either the HRRR forecast (3 km) or the RAP
f00 analysis (13 km) — the observed mesoanalysis, assimilated from obs rather
than projected forward. Same switch drives the contour fields and the
STP/SCP/EHI composites.
Point soundings — Skew-T and hodograph — with derived SBCAPE / LCL / SRH /
SCP / STP / EHI indices from real parcel ascent and Bunkers storm motion,
and the observed radiosonde ascent from the nearest station drawn dashed
beside the model profile (University of Wyoming archive, so an event replay
gets that morning's real balloon, back to 1973).
The VAD wind-profile hodograph, plus a time-height panel of wind barbs
accumulated while the app runs, since the radar only publishes the latest.
HRRR future radar (0–18 h), forecast rotation tracks, near-surface wildfire
smoke, and 0–45 minute optical-flow extrapolation of the radar you're watching.
SPC Day 1–3 categorical outlooks plus Day-1 probabilistic tornado/wind/hail
grids with the significant-severe hatch, and the WFO's Area Forecast
Discussion in-app.
Products computed from the volume itself
VIL density over the Mayfield, KY supercell — computed here from the 11 Dec
2021 volume, four years after it was recorded.
VIL, VIL density and echo tops, integrated here from the stacked tilts
rather than read from a Level 3 grid — so they work in any archive replay,
at the volume's own resolution, with an echo-top threshold you can move.
Maximum expected hail size and probability of severe hail (Witt et al.
1998), with the melting-level and −20 °C heights the algorithm needs sourced
automatically from HRRR instead of typed in by hand. Live only: those heights
come from the current analysis, and applying today's freezing level to a storm
from 2021 would be an answer with no meaning.
Data the app decodes itself
Gridded Level 3: Digital VIL, Enhanced Echo Tops and Hydrometeor
Classification (rain / snow / hail / graupel / biological), via a
from-scratch packet-16 decoder — BZIP2 symbology blocks, ICD float16
thresholds, 0.25-km and 1-km bins, golden-tested against MetPy.
GOES satellite lightning: individual flashes from the GLM, ~40 seconds
behind real time. GLM sees in-cloud flashes a ground network never reports.
The netCDF-4 granules go through a from-scratch minimal HDF5 reader
(crates/hdf5lite), because the reference C library can't ship in the Android
build.
METAR station plots with US-convention wind barbs, flight-category colors
and greedy decluttering — extended offshore and over the Great Lakes by the
NDBC buoy network, where the airport network simply has no stations. Buoys
also print their wave height and dominant period, which is the reason to
look at one.
Wildfires: active perimeters and incident points from the interagency
WFIGS feed, with acres and containment on tap.
Air quality: every AirNow monitor in view as an EPA-category dot with
its AQI (free key in Settings).
TDWR terminal radars: the FAA's airport radars, synthesized into volumes
from their Level 3 tilt products, so all 44 of them behave like any other site.
NHC tropical storms with forecast cones and Saffir–Simpson-colored track
points, the forecast wind field at 34/50/64 kt, potential storm surge,
and hurricane-hunter flight tracks with the measured SFMR surface wind.
SIGMET/AIRMET hazard polygons and PIREPs — what pilots actually flew
through, rather than what was forecast.
Winter: HRRR forecast snowfall, the NOHRSC observed snowfall analysis
(6/24/48/72 h), the Winter Storm Severity Index — how disruptive, not just
how much — and mPING crowd reports of what is actually falling.
WPC Excessive Rainfall Outlook, the flood half of a severe-weather day.
Time machine
Archive playback of any date since June 1991, with the warning polygons and
the local storm reports that were actually in effect at the scrubbed instant.
Volumes from before the dual-polarization upgrade simply don't offer ZDR/CC.
A curated library of historic events, plus your own bookmarks.
An in-RAM decode buffer with one-touch instant replay (R), and
screenshot / GIF / MP4 loop export.
Across your machines
Sign in with Google (Settings → Sync) and your settings, saved locations,
placefiles, palettes and API keys follow you to every machine. The data lives
in your own Drive's hidden per-app folder — no Hook Echo account, no server,
and a scope that cannot see the rest of your Drive. Screen scale and device
name stay local. One-time OAuth client setup: docs/sync.md.
Out in the field
Chase mode: live GPS (gpsd on desktop, the system location service on
Android) drawn as a blue dot on the radar, a storm-relative HUD with closest
approach and escape bearing, and offline "chase packs" of pre-downloaded
basemap tiles.
Position sharing: opt in and every Hook Echo on the same network sees
everyone else's dot, no account and no configuration (UDP broadcast on
:41777). For devices that aren't on one network — the phone chasing on
cellular, the desktop at home — set a relay URL in the same panel: any HTTP
endpoint you host that takes POST of one position and returns GET of the
list. There is no default relay; the endpoint sees your live position.
Streamer/OBS mode: chrome-free UI (F8) and an auto-tour of active
warnings (F9).
Click anywhere for historical tornado tracks near that point (SPC 1950–2022)
with an EF-scale histogram, plus how often that spot has actually been warned —
warning counts by type, first year on record, busiest year and worst day.
NWS damage surveys: the EF-rated damage points and surveyed track a survey
crew filed after the storm, with photos, on the day your timeline is showing.
Ground truth to lay over the hook you were watching.
Listen to a NOAA Weather Radio relay while you watch (bring your county's
stream URL — NOAA broadcasts on VHF and streams nothing itself).
Draw on the map freehand to circle the storm you're talking about, and look
through webcams to see what the sky actually looks like. The FAA's ~2,600
airport cameras need no key but stop at the US border; a free Windy key in
Settings adds their global network, which returns the 50 most popular cameras
in view rather than every one of them.
Animated wind: HRRR 10 m wind drawn as drifting particles, coloured by
speed — the Windy look, built from NOAA's own free GRIB grids rather than
licensed, so it needs no key and works offline of any paid API. CONUS only,
because HRRR is. Model output, not observation, and the layer says so.
Minute-by-minute rain for the spot you tapped: the next hour advected off
the current scan, above the hourly forecast — when it starts, when it stops.
Share the view: the palette copies a hookecho:// link carrying the site,
place, zoom and (when you're scrubbed back) the time. Opens the app right
there — on Android, straight from the link.
Android home-screen widget: what's warned at your saved locations, tap to
open the map on it.
Per-layer opacity in the Layer Manager, for field layers as well as
placefiles, and the scrub bar now shades its forecast tail so a model hour
never reads as radar.
Open this view in Windy from the command palette when you want their
models next to ours — same place, same zoom, matching overlay.
Live station cards: click a surface station and get a floating,
draggable card — a live highway camera on top, then the station's local clock
and how stale its reading is, temperature with humidity and dewpoint, a wind
dial with the trailing-gust ladder (10 s through 24 h), and the electric field.
Open as many as you want, one per station.
Airport METARs need no key; a WeatherFlow Tempest token or a Weather
Underground key adds personal weather stations. Camera video is MJPEG decoded
in-app, or HLS if you have ffmpeg installed — the card says so plainly when
you don't, and everything else on it keeps working.
Cameras come from the FAA and from Caltrans, whose twelve districts publish
~3,300 cameras keyless and stream video from most of them. No other state DOT
publishes an open camera API, so that is the coverage, not a national map.
The electric field is NOAA's PPEF model: the equatorial ionospheric field
in mV/m, predicted from solar wind. That is space weather, not the storm over
your head — for the kV/m a chaser means, point the card at a ground field
mill's JSON in Settings and it charts that instead.
On Android the cards work the same, minus live video: the camera shows its
newest still instead, refreshed on the poll clock (a phone can't spawn ffmpeg,
and a video decoder per open card is not what its battery is for).
Multi-pane layouts, placefiles with icon sheets and a layer manager, a sensor
dashboard, range rings, 13 themes, and tray-based background alerting.
On your phone
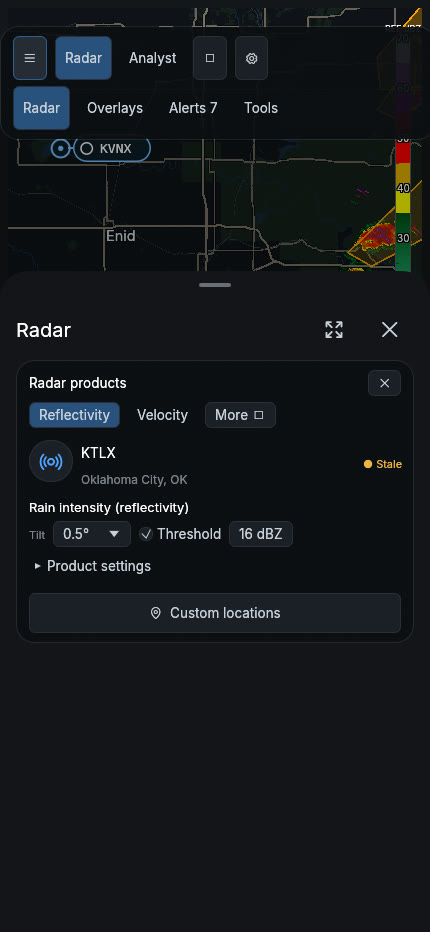
The same Rust app, rebuilt around the phone. KTLX 0.5° reflectivity,
20 May 2013, playing out of the archive at half speed with the tornado warnings
of the day counting up on the alert badge.
Android is not the desktop squeezed onto a smaller screen — it is a Material 3
layout over the same renderer, the same data paths and the same action registry:
Map first. The radar owns the screen; one chip names the site and VCP.
One sheet, three snaps. Drag it up for the scrubber, speed, products and tilts; drag it to full for the archive.
Everything else is a sheet. The same described, categorized action registry the desktop sidebar uses.
Alerts in view, tap to fly there and read the full text.
A docked five-action toolbar along the sheet's bottom edge — no second bar
stacked under it.
Every tool window (soundings, cross-sections, settings, the site picker) is a
full-screen surface, because that is what the compact width class is for.
Real WindowInsets, including the keyboard, so a focused field rises above it.
The real system IME through GameActivity: autocorrect, suggestions, and every
language the phone has, instead of NativeActivity's raw ASCII key events.
Predictive back: back dismisses the innermost surface, and with nothing open
Android draws its own home-screen preview as you drag.
In landscape the sheet becomes a full-height side rail.
Native GPS for chase mode, and opt-in background alerting: a foreground
service watches your saved locations and notifies you with the app closed,
tiered by watch / warning / emergency, tapping through to the storm.
Without opening the app
hookecho --status prints what's happening at your saved locations — current
conditions from the nearest station and any active alert whose polygon comes
within that location's watch radius:
Mount your settings so it reports on your saved locations. The image is ~660 MB
because it carries Mesa's lavapipe software Vulkan driver — that's what renders
/snapshot.png with no GPU and no display attached.
It binds loopback unless you tell it otherwise. This endpoint says where you
live and what is warned there; --bind 0.0.0.0 exposes that to everything on
your network, and there is no authentication in front of it. Put it behind a
reverse proxy if it needs to leave the machine.
In Home Assistant
The command_line sensor above is the no-install path. For something richer
there's a custom component in custom_components/hookecho:
point it at a machine running --serve and you get, per saved location, a
device carrying temperature, dewpoint, humidity, wind, gust and pressure
sensors, an alert count sensor and an alert active binary sensor
(attributes: event, expiry, distance, escalation tier), plus one radar
camera entity showing the live snapshot.
Install via HACS as a custom repository, or copy the custom_components/hookecho
directory into your Home Assistant config/custom_components/ and restart. Then
add the integration and give it the host and port. Polling is once a minute,
which is the server's own cache window.
Remember the server has to be reachable from Home Assistant — that means
--bind 0.0.0.0 (or the container), and a network you're willing to expose your
saved locations on.
In a browser
The app also builds for wasm and runs on a canvas — the same HookEchoApp, not
a cut-down viewer. Build it and serve it:
cargo install wasm-bindgen-cli # once
./scripts/web/build.sh
cargo run --release -- --serve 8080 --web-root web
Then open . Radar, the vector basemap, alerts and point
forecasts all work: the Level 2 buckets and api.weather.gov allow cross-origin
requests. This is a core viewer, though, not parity. There is no filesystem,
so settings are defaults each load and caches are memory-only; there is no live
chunk stream, no audio or spoken warnings, no camera, plugin or GPS support, and
any feed whose host refuses cross-origin requests simply doesn't load. Anything
that needs those is on the desktop and Android builds.
Extending it
Placefiles work as they do everywhere else — URLs, icon sheets, a layer manager with per-file
opacity and paint order. Beyond that, anything that can print a placefile can be a plugin: the app
runs your command on a cadence, hands it the current site, view box, product and the instant on
screen (so it works during an archive replay too), and draws what comes back. No SDK, no build
step, no language requirement — the shipped examples are a Python script and twenty lines of
shell. See docs/plugins.md.
Repository layout
crates/hookecho — the app: egui UI and wgpu render pipelines.
crates/wxdata — data plumbing: Level 2 (AWS), MRMS, HRRR (future radar and
environment fields), NWS alerts with storm motion and escalation, IEM archived
warnings and live/archived storm reports, SPC outlooks and climatology, METAR,
NHC tropical, aviation SIGMETs, Area Forecast Discussions, ProbSevere,
placefiles, spotters, GOES GLM lightning, WPC surface fronts, NWS point
forecasts, TDS detection, sounding indices, and CAPPI/cross-section/3D
resampling.
crates/nexrad-level3 — from-scratch NEXRAD Level 3 (RPG) product decoder:
storm-cell packets (15/19/20/23) and digital radial arrays (packet 16 —
DVL/EET/HHC), golden-tested against MetPy.
crates/hdf5lite — minimal read-only HDF5 reader, just enough for the
netCDF-4 files NOAA publishes. Exists because the reference reader is a C
library the Android build can't take; checked against h5py on real granules.
scripts/shots — the screenshot harness that produced everything above.
Also worth reading: docs/DATA.md — every feed the app decodes,
with its cadence, latency and whether it needs a key; ROADMAP.md —
what's next and what isn't planned; CONTRIBUTING.md — how the
workspace fits together and what a patch has to clear.
Verification
Every data-backed feature has a headless CLI verifier (renders a PNG or prints a
report without opening a window), e.g.:
cargo run --release -- --headless out.png KTLX --moment VEL --dealias
cargo run --release -- --headless-mrms mosaic.png
cargo run --release -- --headless-alerts # motion + escalation lines
cargo run --release -- --headless-archwarn 2013-05-20T20:00:00Z
cargo run --release -- --headless-env sbcape cape.png # sbcape|mlcape|srh1|srh3
cargo run --release -- --headless-field preciptype ptype.png
cargo run --release -- --headless-l3grid hhc KTLX hca.png # dvl|eet|hhc
cargo run --release -- --headless-metar KTLX
cargo run --release -- --headless-tropical
cargo run --release -- --headless-cappi KTLX 3 cappi.png
cargo run --release -- --headless-reports 2013-05-20T19:00Z 2013-05-20T21:00Z
cargo run --release -- --headless-afd KTLX
cargo run --release -- --headless-aviation
cargo run --release -- --headless-indices -97.5 35.3
cargo run --release -- --headless-glm # GOES satellite lightning
cargo run --release -- --headless-fronts # WPC surface analysis
cargo run --release -- --headless-hrrr uh 3 uh.png # refc|uh|smoke
cargo test # 303 offline unit tests
The screenshots in this README are regenerated by scripts/shots/shoot.sh,
which drives the real binary on a nested X display — see
scripts/shots/README.md.