simple-dap-gui - Xdebug Debugger GUI


A standalone DAP (Debug Adapter Protocol) client GUI application built with Electron, React, TypeScript, and PrismJS. Primarily designed for PHP debugging with Xdebug.
Features
- Xdebug / PHP Focus: First-class support for PHP debugging via the
vscode-php-debug adapter
- PrismJS Code Viewer: Lightweight, read-only code viewer with syntax highlighting and breakpoint gutter support
- Path Mapping: Full support for remote debugging with
${workspaceFolder}, ${userHome}, ${workspaceFolderBasename}, and ${pathSeparator} resolution in path mappings
- Global Launch Configurations: Define launch configurations in Settings that appear in every workspace, alongside
.vscode/launch.json
- Exception Breakpoints: Stop on Notice, Warning, Error, Exception, or Everything from the Breakpoints panel
- Disconnect: Detach the debugger and let the target process keep running
- Persistent Breakpoints: Optional setting to save and restore breakpoints across sessions
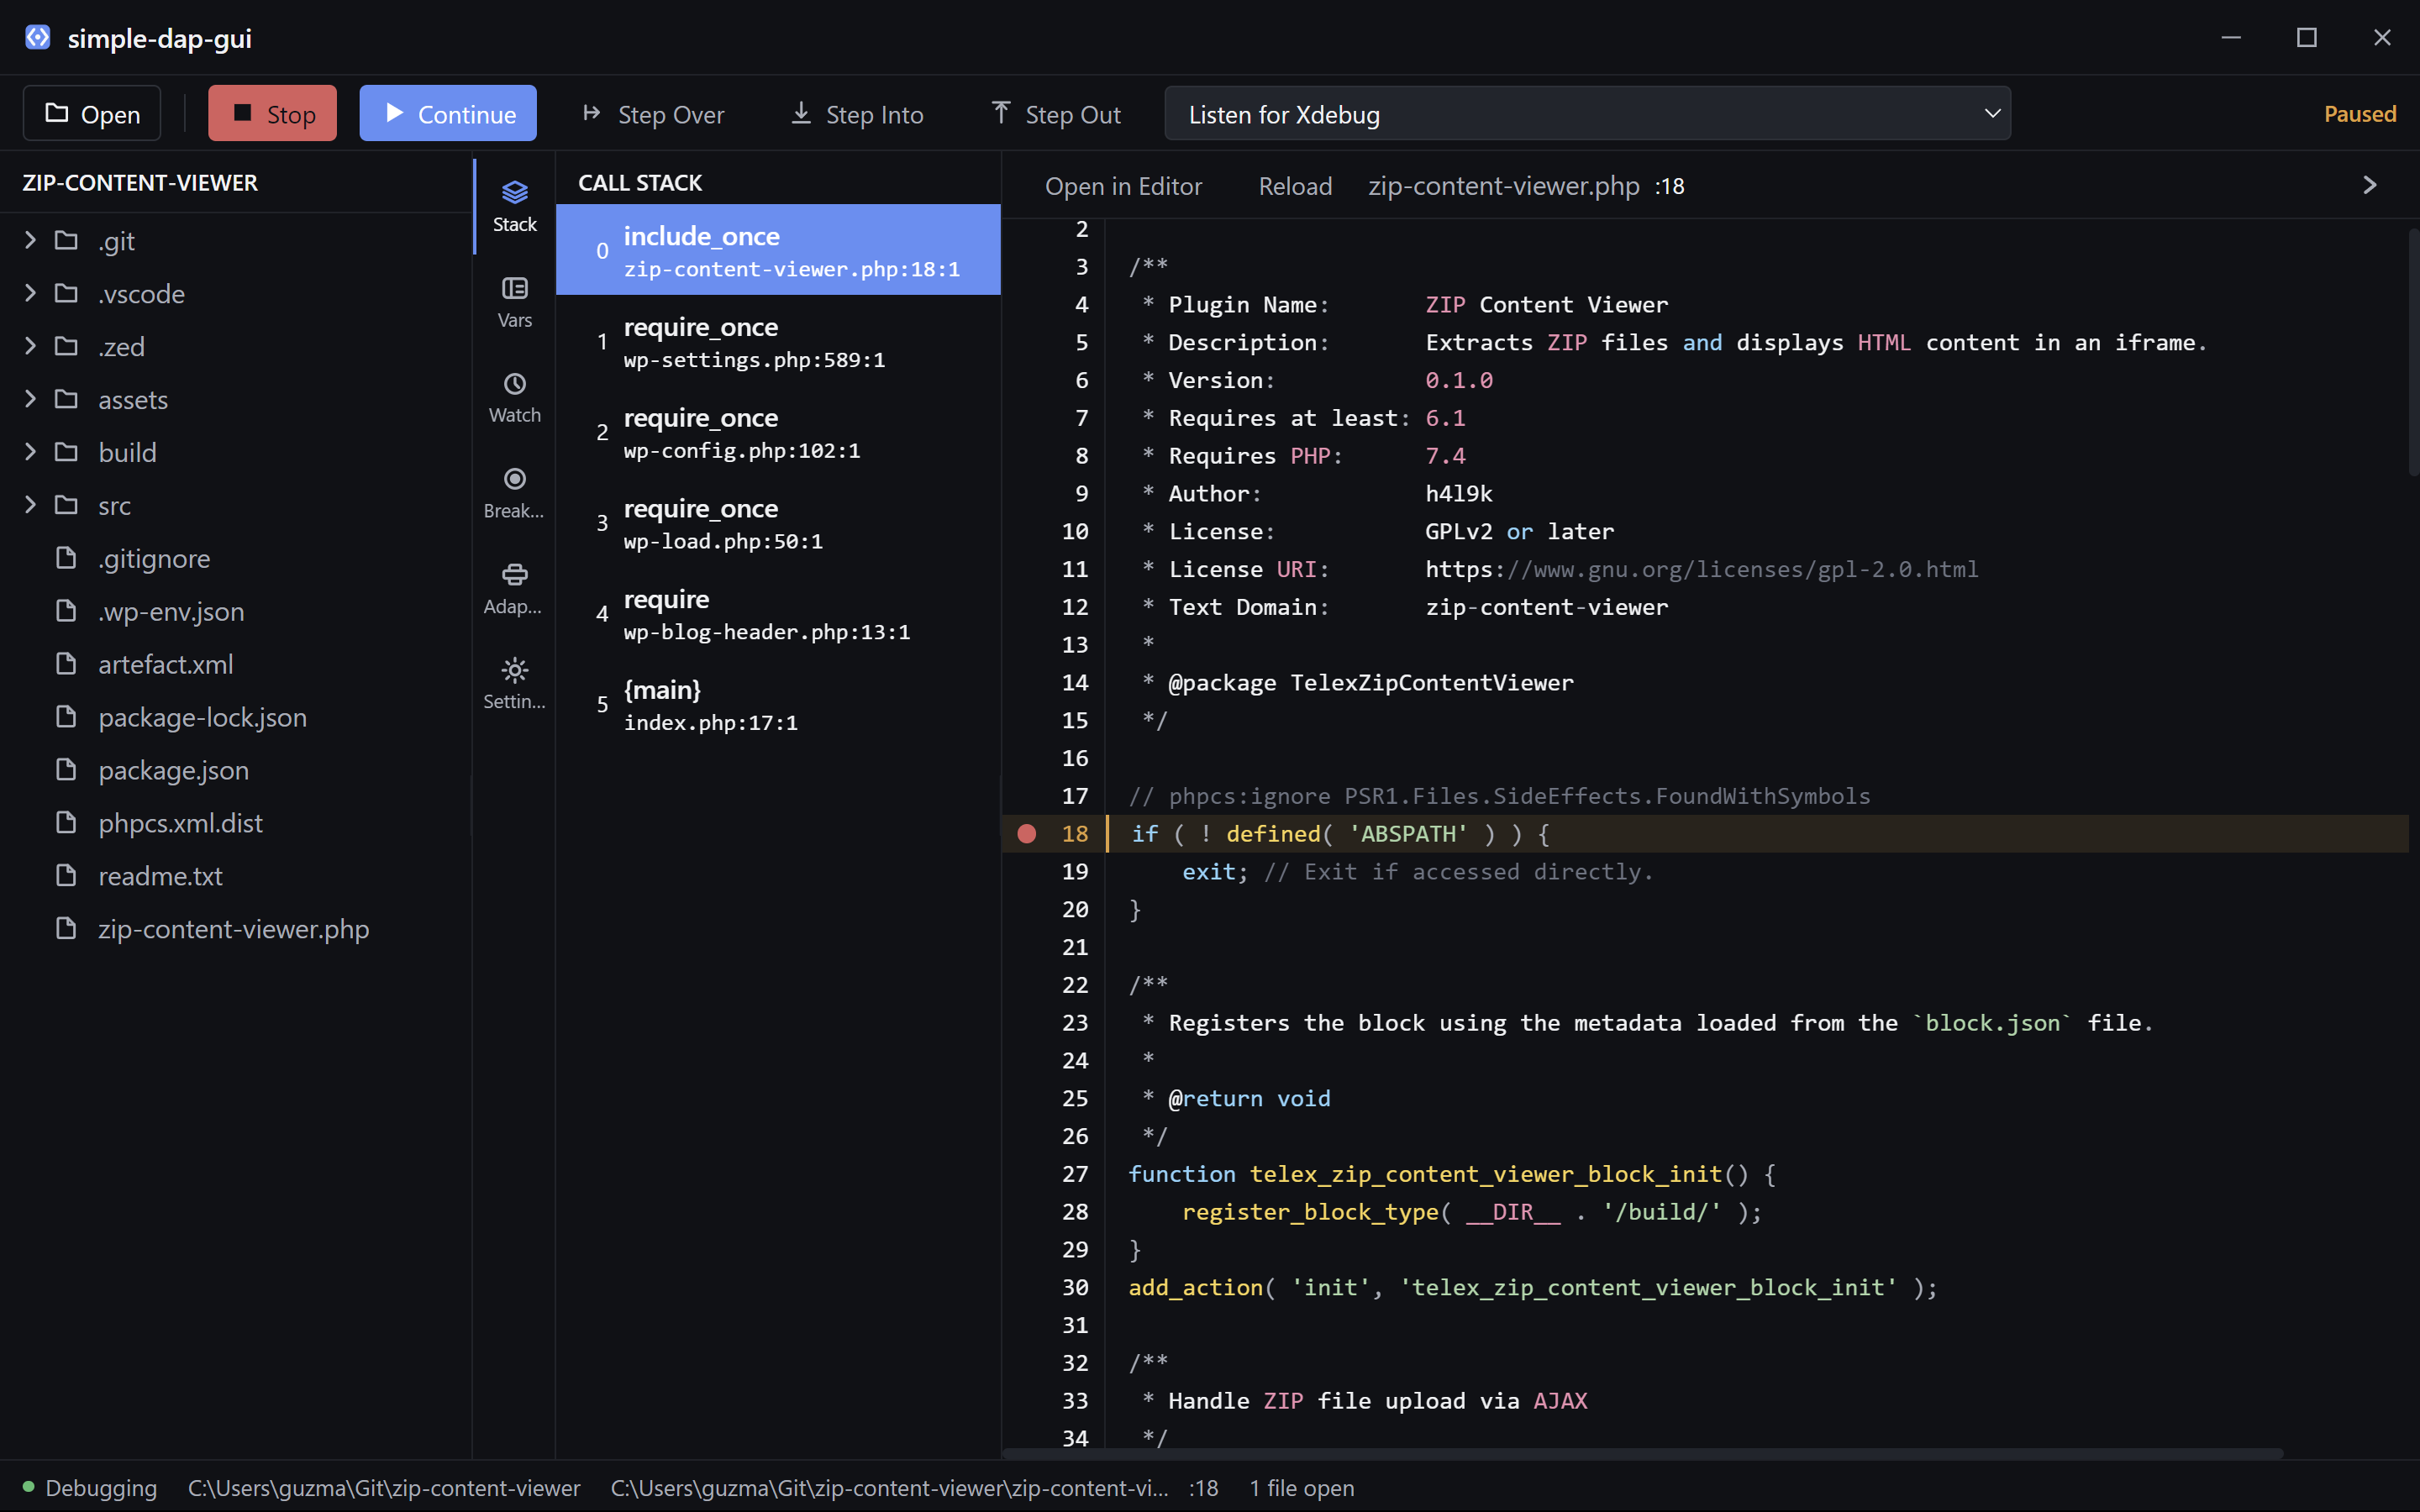
- Call Stack View: Navigate through the call stack during debugging — click any frame to jump to its source
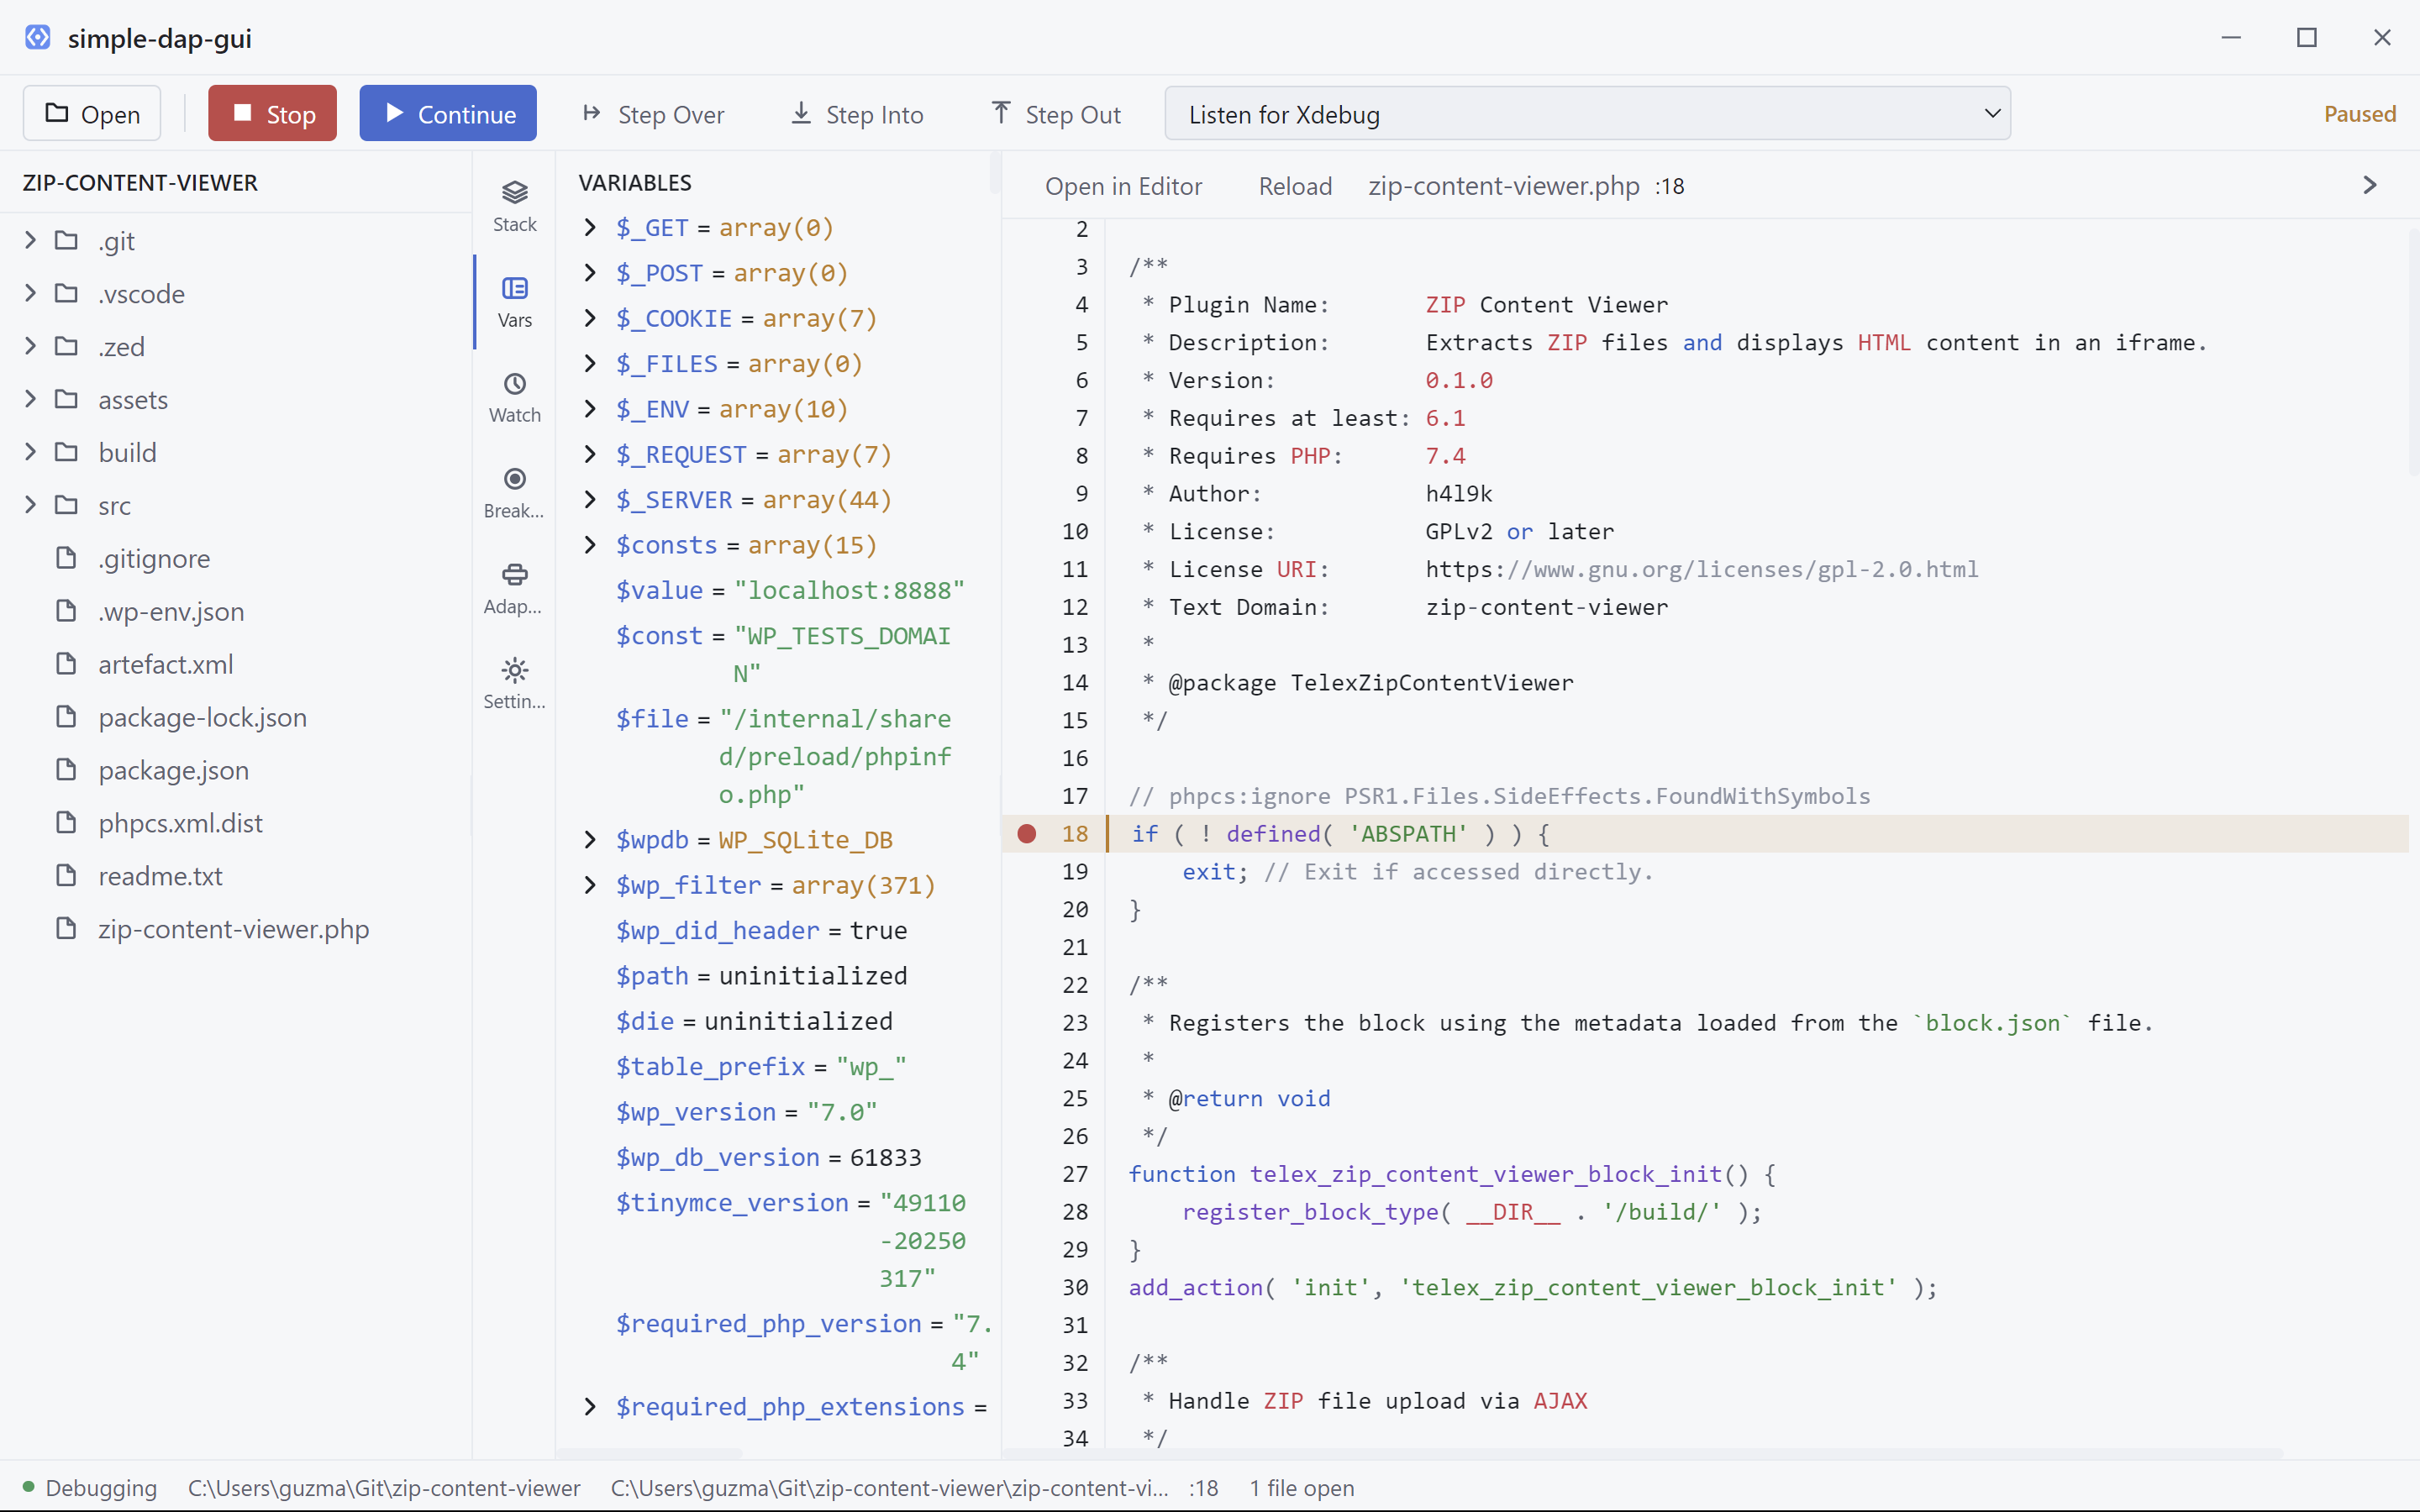
- Variables Panel: Inspect variables at different scopes with expandable children
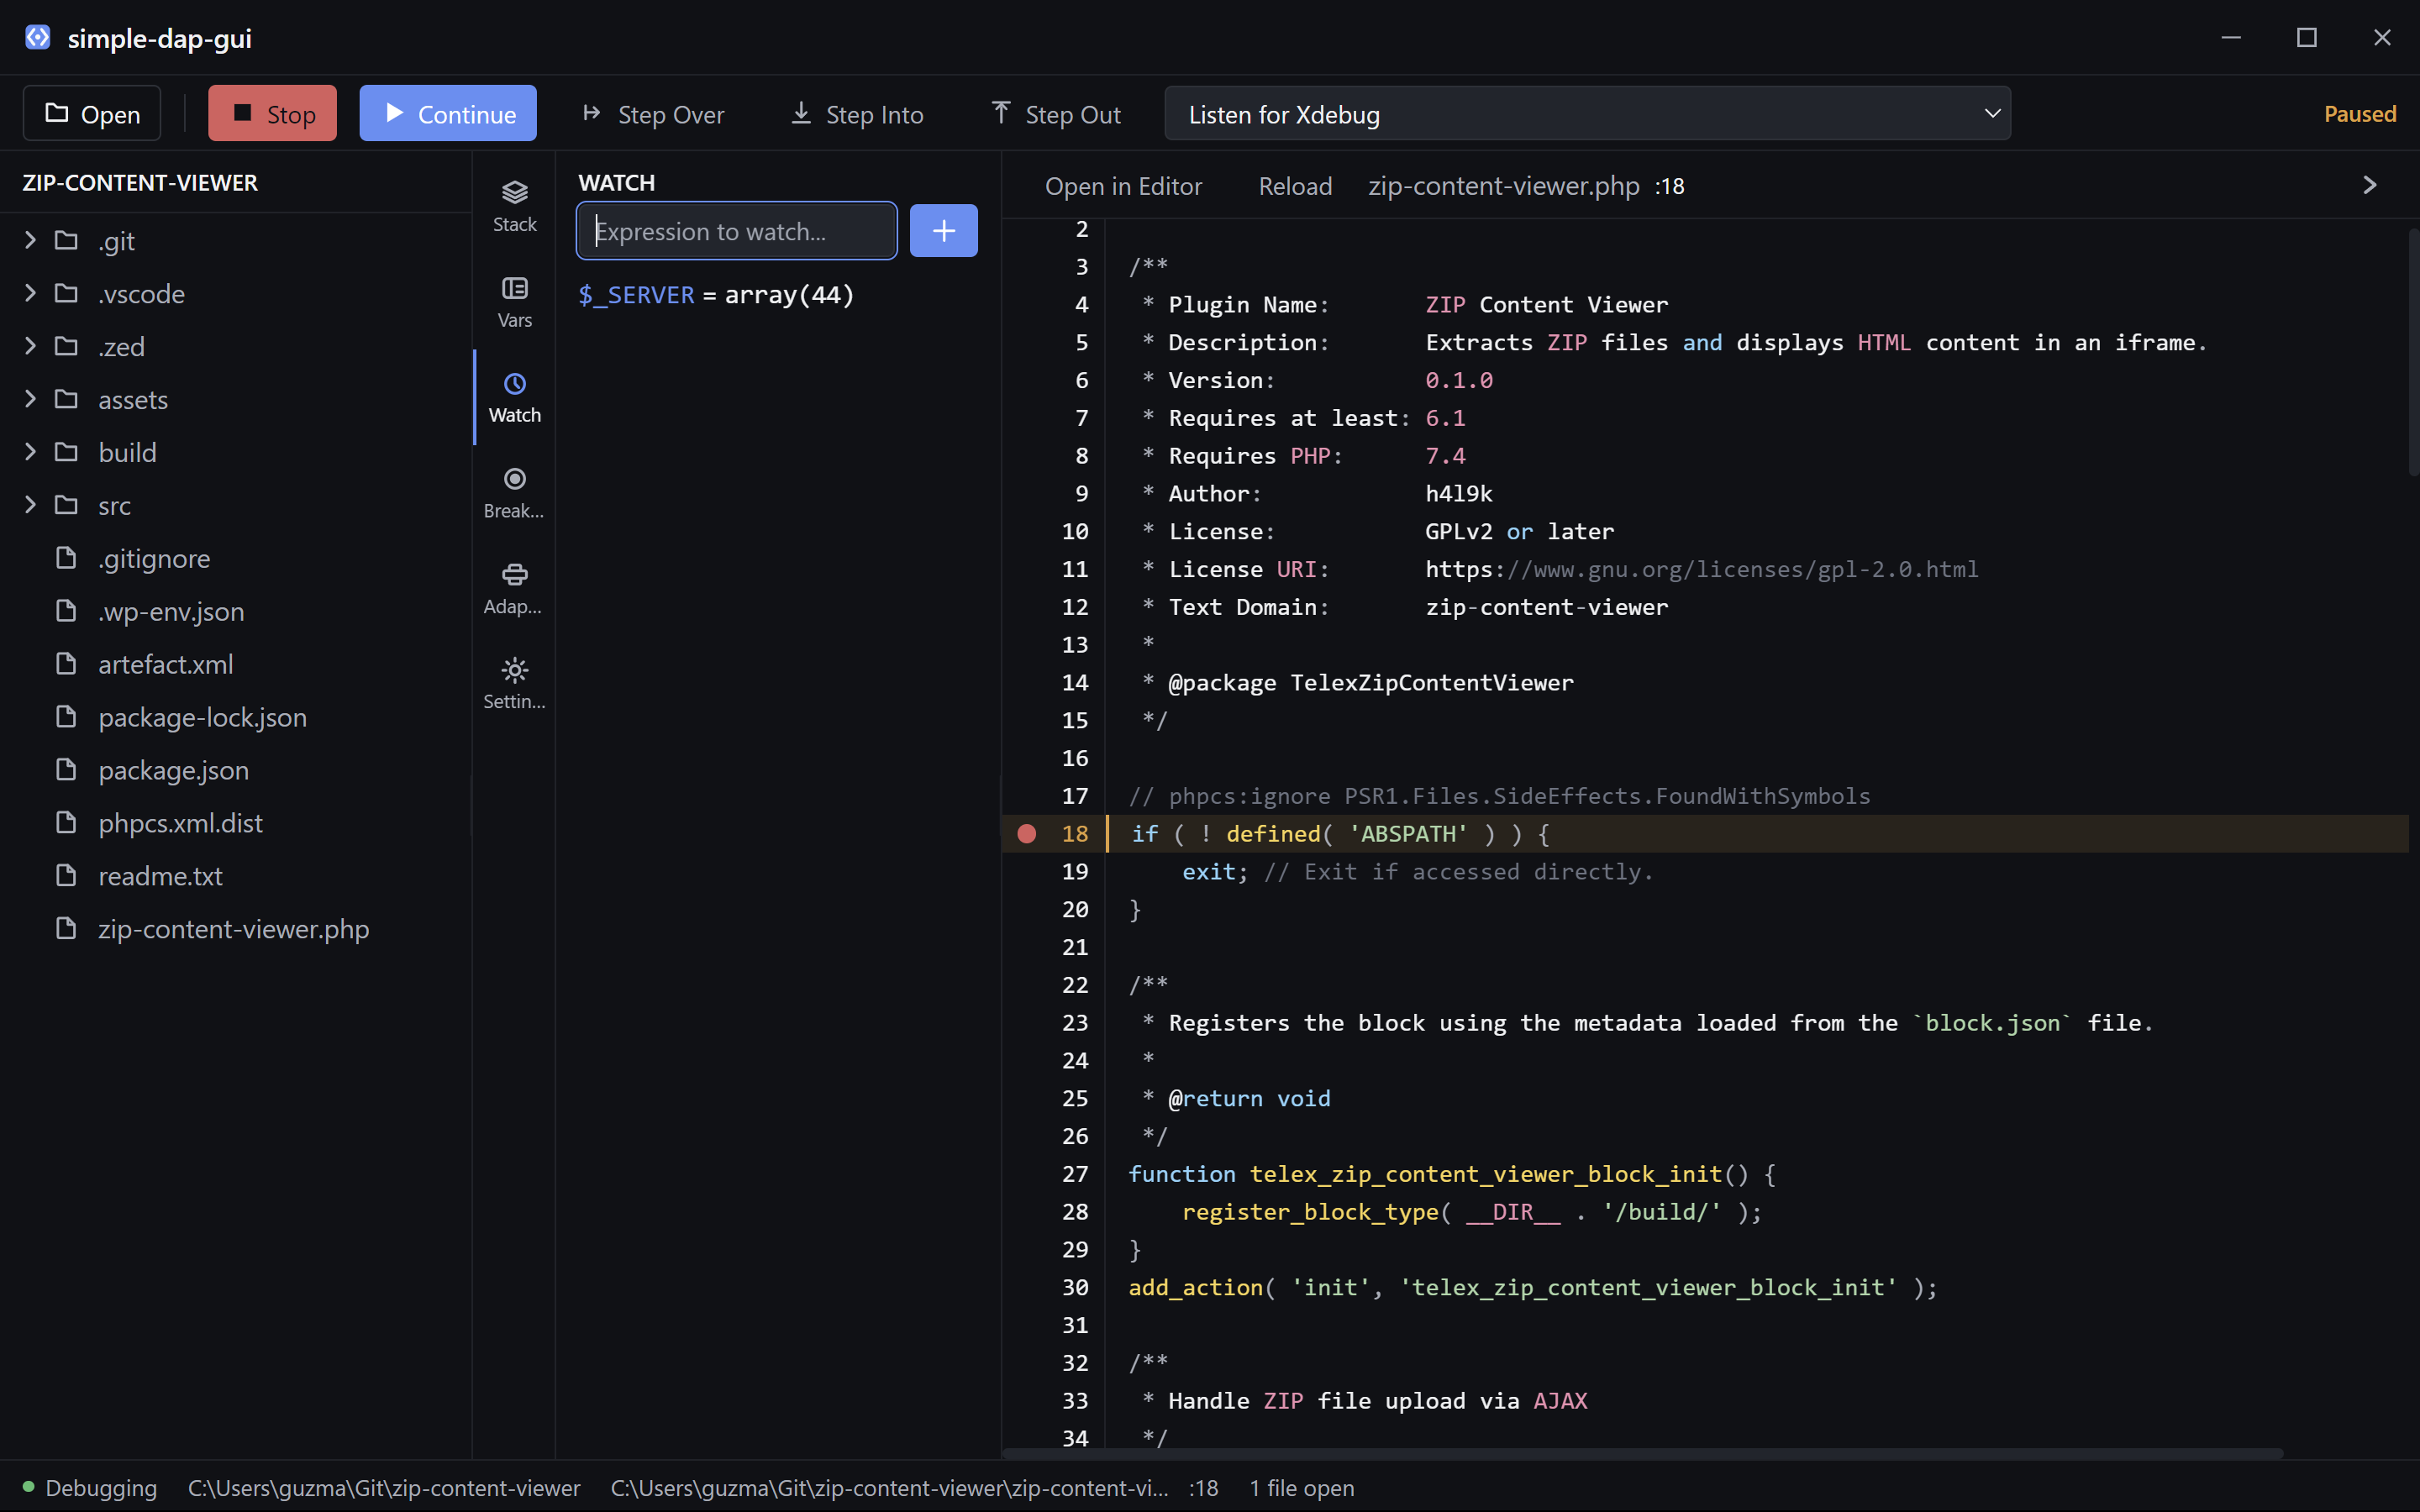
- Watch Panel: Evaluate and monitor custom expressions while debugging
- Dark/Light Theme: Toggle between dark and light editor themes via settings
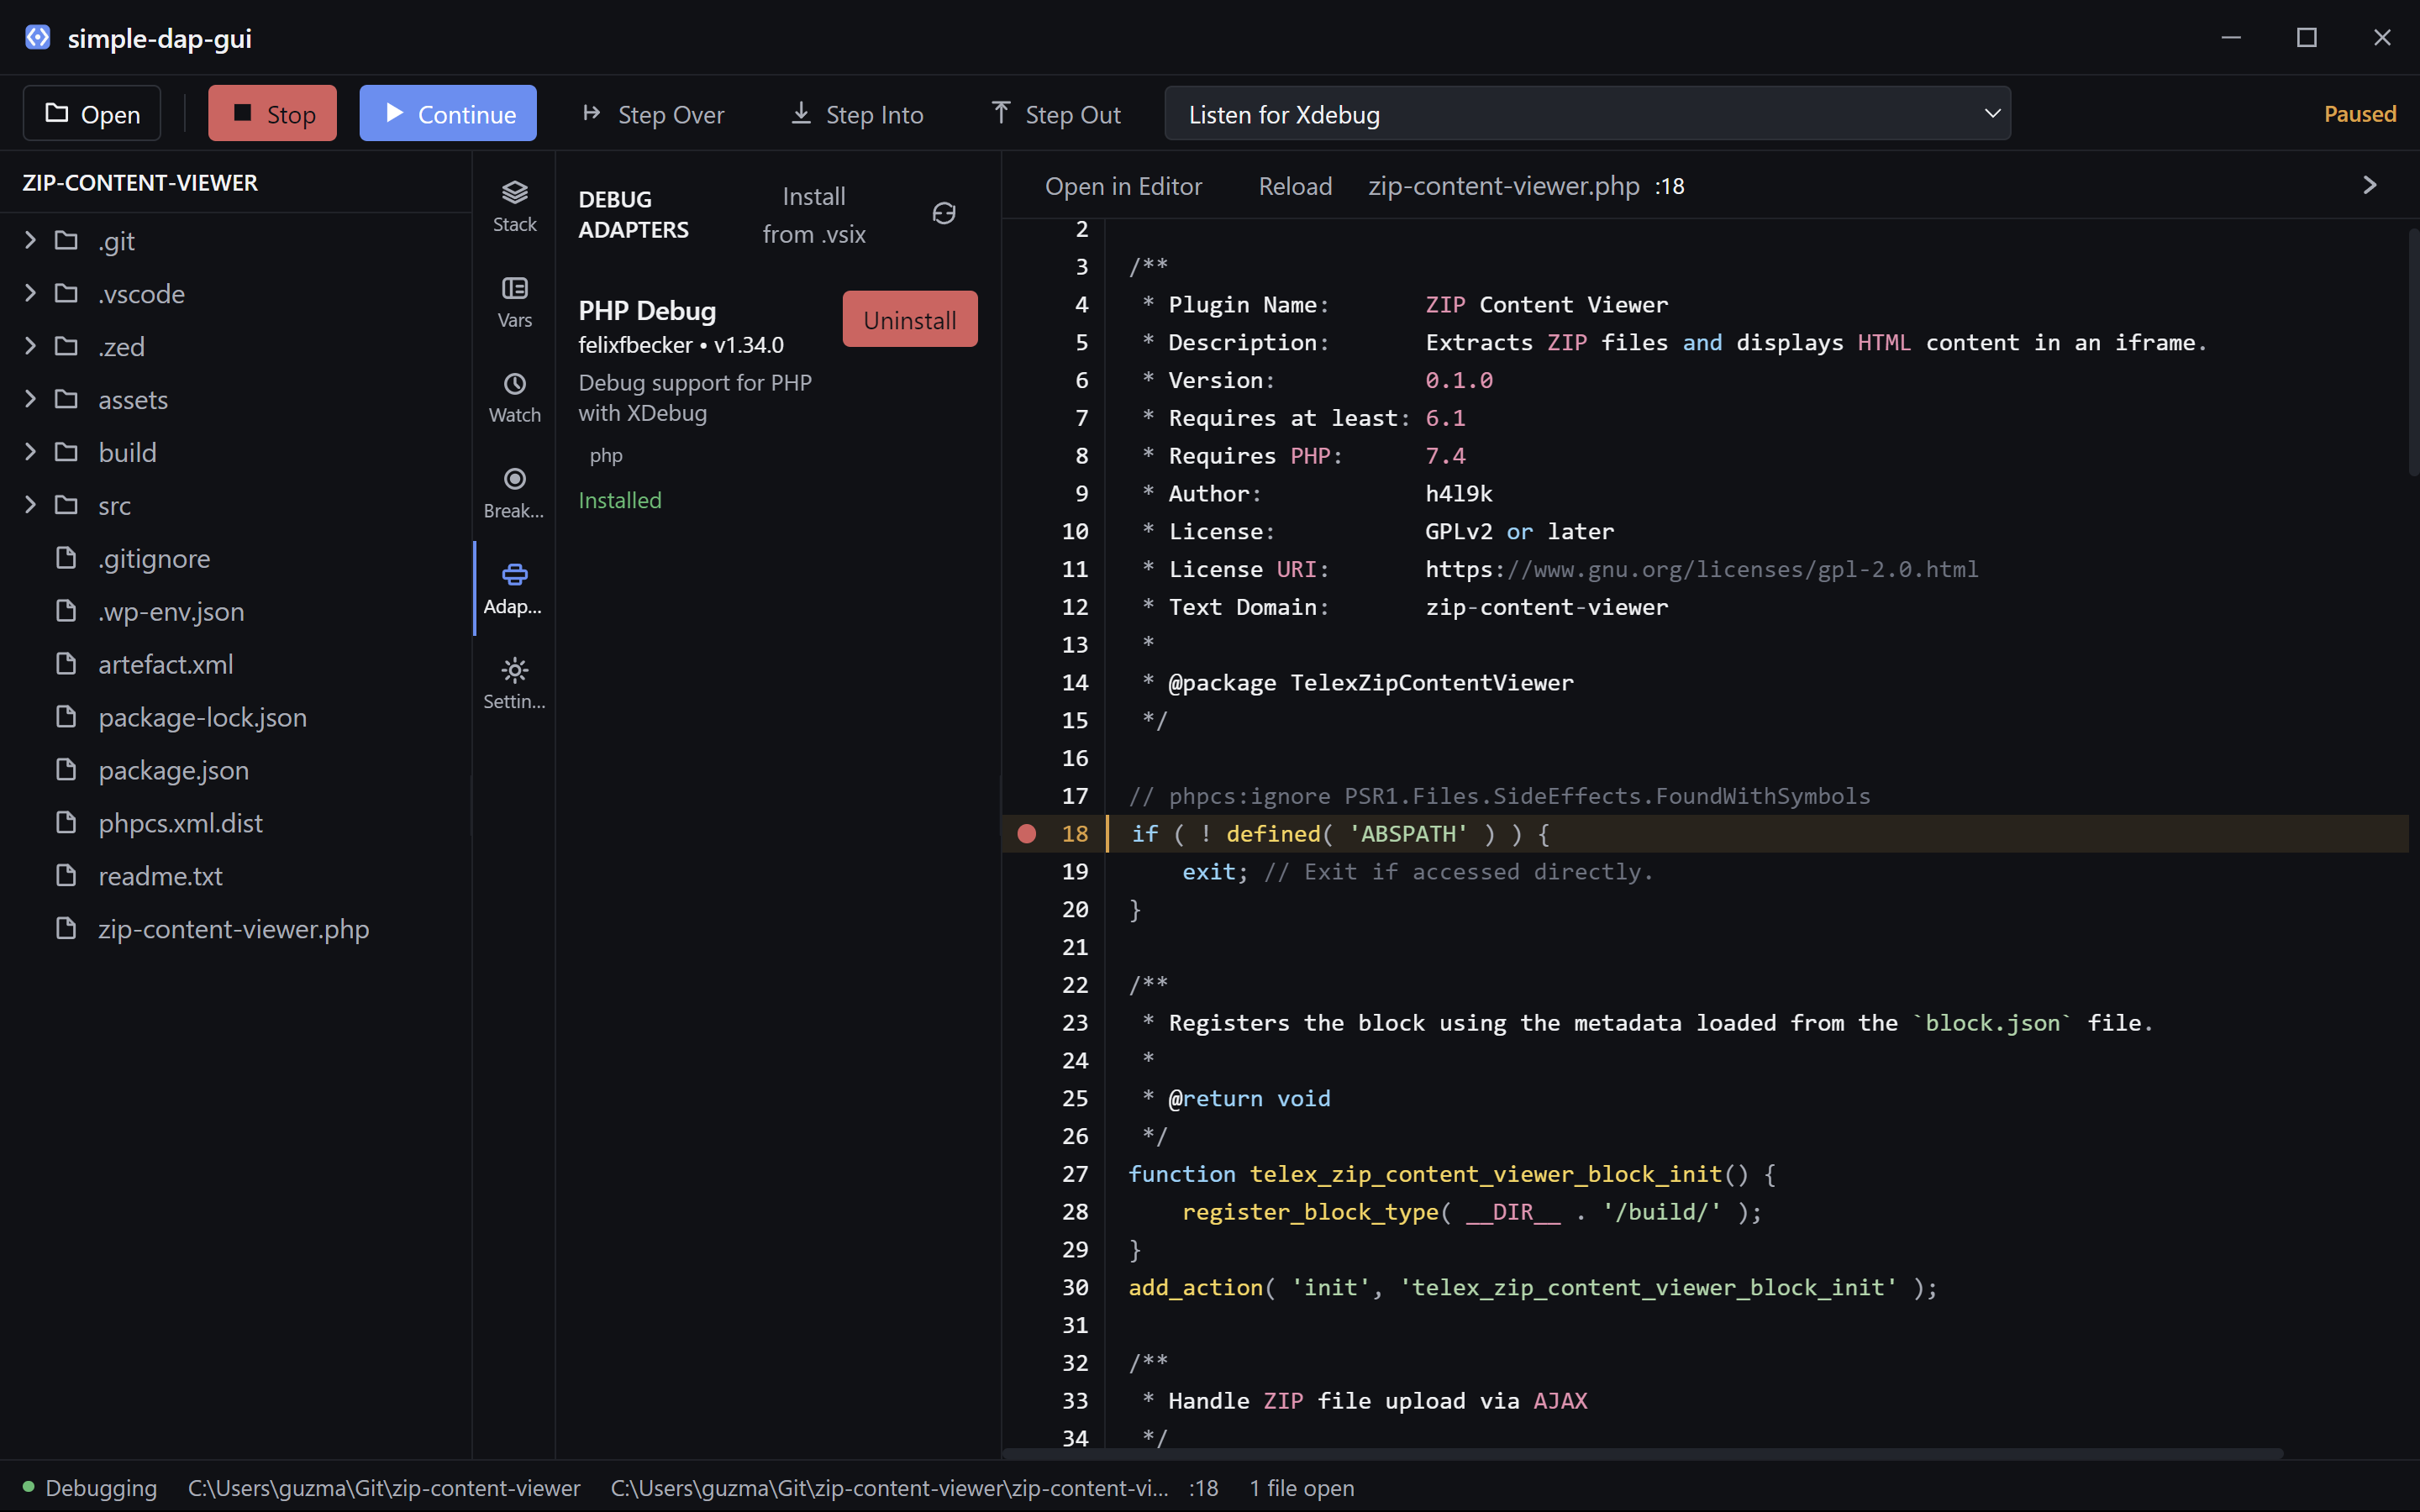
- Debug Adapter Management: Built-in manager to install/uninstall DAP adapters (custom .vsix install supported)
- App Logo & Icons: Simple code-brackets SVG brand mark, generated as PNG/ICO assets for all platforms
- Workspace Integration: Open workspace directly in your preferred external editor
- Current Line Highlight: The active execution line is highlighted with a theme-aware color in both the gutter and the code view
- Monochrome Tool UI: Flat, borderless chrome with a single accent color and monochrome SVG icons
- Keyboard Shortcuts: Standard debug shortcuts (F5, F10, F11, Shift+F5, Shift+F11)
Screenshots
Breakpoint Gutter (Dark Theme)
Click the gutter to toggle breakpoints. The current execution line is highlighted in yellow.
Breakpoint Gutter (Light Theme)
The same view in light mode.
Watch Panel
Monitor custom expressions as you step through code.
Adapter Manager
Install, uninstall, and manage DAP adapters from the built-in catalog.
Project Structure
dap-gui/
├── electron/              # Electron main process
│   ├── main.ts           # Entry point
│   └── preload.ts        # Preload script for IPC
├── src/
│   ├── dap/              # DAP protocol implementation
│   │   ├── client.ts     # DAP client with protocol parser
│   │   ├── session.ts    # Debug session management
│   │   └── types.ts      # TypeScript type definitions
│   ├── components/       # React components
│   │   ├── Editor/       # PrismJS code viewer
│   │   ├── FileExplorer/ # Workspace file tree with lazy loading
│   │   ├── Panels/       # Side panels (stack, variables, watch, breakpoints, settings, adapters)
│   │   ├── Toolbar/      # Debug controls
│   │   └── StatusBar/    # Status bar
│   ├── styles/           # Theme CSS (dark/light) with CSS custom properties
│   ├── stores/           # Zustand state stores
│   └── utils/            # Helper utilities
└── ...
Installation
Package managers (recommended)
Once published, install the app through your platform's package manager:
- Windows (Winget):
winget install guzmandrade-dev.simple-dap-gui
- macOS (Homebrew):
brew install --cask simple-dap-gui
- Linux (Flatpak/Flathub):
flatpak install flathub com.guzmandrade.SimpleDapGui
> Note: Installers are currently not code-signed. On Windows you may see a Microsoft Defender SmartScreen prompt the first time you run the app; click More info → Run anyway to proceed.
macOS: Running the unsigned app
Because the app is not currently code-signed or notarized, macOS Gatekeeper may show an error such as “simple-dap-gui is damaged and can’t be opened” after downloading a release.
The app is not actually damaged; macOS has added a quarantine flag to the downloaded file and is refusing to run unsigned software.
To run it, use one of the following methods:
Option 1 — Remove the quarantine flag (recommended)
Open Terminal and run:
xattr -rd com.apple.quarantine /Applications/simple-dap-gui.app
Then launch the app normally.
Option 2 — Open via System Settings
- Try to open the app once (Gatekeeper will block it).
- Open System Settings > Privacy & Security.
- Scroll down and click Open Anyway next to the
simple-dap-gui message.
Launch from the command line (macOS)
The app accepts a project folder as its first positional argument:
/Applications/simple-dap-gui.app/Contents/MacOS/simple-dap-gui /path/to/your/project
To make simple-dap-gui available as a regular shell command, create a symlink:
ln -s /Applications/simple-dap-gui.app/Contents/MacOS/simple-dap-gui /usr/local/bin/simple-dap-gui
Then you can open projects with:
simple-dap-gui /path/to/your/project
> If you install the app somewhere other than /Applications, adjust the path in the symlink accordingly.
Releases are published automatically from GitHub Releases via:
From source
# Install dependencies
npm install

# For PHP debugging, install the PHP debug adapter:
# Option 1: Download from GitHub releases
# https://github.com/xdebug/vscode-php-debug/releases

# Option 2: Clone and build
git clone https://github.com/xdebug/vscode-php-debug.git
cd vscode-php-debug
npm install
npm run build
# Copy out/ folder to your project
Usage
- Create a launch.json in your project's
.vscode/ folder:
{
  "version": "0.2.0",
  "configurations": [
    {
      "name": "Listen for XDebug",
      "type": "php",
      "request": "launch",
      "port": 9003,
      "pathMappings": {
        "/var/www/html": "${workspaceFolder}"
      }
    }
  ]
}
- Start the application:
npm run dev
-
Select a configuration from the dropdown in the toolbar
-
Click Debug (or press F5) to start debugging
-
Set breakpoints by clicking in the gutter area
-
Toggle Theme between dark and light via the Settings panel
Keyboard Shortcuts
| Shortcut | Action |
|---|
| F5 | Start Debugging / Continue |
| Shift + F5 | Stop Debugging |
| F10 | Step Over |
| F11 | Step Into |
| Shift + F11 | Step Out |
| Toolbar | Disconnect (detach without killing the process) |
Changelog
0.4.7
- Winget Command Shim: Added
Commands: to the winget installer manifest so the portable package exposes simple-dap-gui on PATH after installation.
- Search Modal Theme: Fixed the search modal background in the light theme so it no longer appears transparent over the backdrop.
- Settings JSON Readability: Fixed the Global Launch Configurations textarea colors in dark mode so the JSON text is readable.
0.4.6
- File & Content Search: Added a search modal (
Ctrl+P / Ctrl+Shift+F) with fuzzy file-name search powered by fuzzysort and fast content search powered by ripgrep, with a pure-JavaScript fallback when rg is not installed.
- Native Application Menu: Restored the native menu bar so the window can be closed via the menu on all platforms, and macOS no longer overlaps the custom title bar with the system one.
- Windows Title Bar: Native window controls are now shown by default on Windows instead of being hidden.
- Debug Stop Outside Workspace: Added a guard when the debugger stops on a file outside the current project folder.
- Current Line Highlight: The active line is now highlighted in both the gutter and the code view. Clicking a line sets the current line and highlights it without scrolling.
- Jump to Line from Search: Clicking a content search result opens the file and jumps to the matched line.
- Theme Readability: Improved the search modal and current-line highlight contrast in the light theme.
- Removed
ripgrep-js dependency: Replaced the buggy wrapper with a custom execFile-based implementation.
Panels
Variables
Inspect local and global variables at the current stack frame. Expand arrays and objects to view their children.
Watch
Add custom expressions (e.g., $myVariable, $_SERVER['REQUEST_URI']) to monitor their values as you step through code. Watches are re-evaluated automatically on every stop.
Call Stack
Navigate between stack frames to inspect variables at different levels of execution. Click any frame to jump directly to its source file and line in the editor.
Breakpoints
View and manage all breakpoints set across the workspace. Use the Stop On section to break on PHP notices, warnings, errors, exceptions, or everything. Enable Persistent Breakpoints in Settings to save them to .vscode/dap-gui.breakpoints.json and restore them on the next session.
Adapters
Install, uninstall, and manage DAP adapters. The built-in catalog currently lists the PHP Debug adapter. You can also install any adapter from a .vsix file.
External Editor Integration
Configure your preferred editor in the Settings panel:
- VS Code (default):
code
- Zed:
zed
- Vim (terminal):
vim
- Custom command with argument templates (
{file}, {line})
Use "Open Workspace in Editor" to open the current workspace root directly. External editor commands are resolved against your PATH (where on Windows, which on macOS/Linux) with a fallback to common install locations.
Collapsible Layout
Click the → arrow in the editor header to collapse the editor panel. This gives the file explorer and debug panels more room. When collapsed:
- The file explorer and sidebar share the available space
- You can still resize the split between them
- Click any file in the explorer to auto-expand the editor
- Use the ← button on the far right to restore the editor
Theme & Appearance
The app supports dark and light themes via CSS custom properties mapped to Tailwind's semantic color tokens (bg-panel, text-accent, border-danger, etc.). Themes are persisted to localStorage and switch instantly across the UI and PrismJS code viewer.
Debug Adapter Management
Install or uninstall DAP adapters from the Adapters panel. The manager tracks installed adapters, their paths, and supported languages.
Current Focus
- PHP:
vscode-php-debug — primary and tested adapter
Roadmap
Future versions may expand first-class support to:
- Python:
debugpy
- Node.js: Built-in DAP support
- C/C++:
vscode-cpptools
In the meantime, any DAP-compatible adapter can be installed manually via the Install from .vsix button.
Development
# Run in development mode with hot reload
npm run dev

# Build for production
npm run build

# Preview production build
npm run preview
Path Mapping
The application supports path mappings for remote debugging. Configure them in your launch.json:
"pathMappings": {
  "/server/path": "${workspaceFolder}/local/path",
  "/wordpress": "${userHome}/Git/WordPress",
  "/wordpress/wp-content/plugins/${workspaceFolderBasename}": "${workspaceFolder}"
}
The following variables are resolved in both the server and local sides of each mapping:
${workspaceFolder} — current workspace root${workspaceFolderBasename} — last segment of the workspace root${userHome} — user home directory${pathSeparator} — / on macOS/Linux, \\ on Windows
Mappings are applied in order, so more specific prefixes should be listed before broader ones.
Global Launch Configurations
In addition to per-project .vscode/launch.json files, you can define launch configurations globally in Settings:
- Open the Settings panel
- Scroll to Debugger > Global Launch Configurations (JSON)
- Enter a JSON object in the same format as
.vscode/launch.json
- These configurations appear in the toolbar dropdown for every workspace
Workspace configurations override global ones by name.
Persistent Breakpoints
By default, breakpoints are kept in memory only. To save them across sessions:
- Open the Settings panel
- Check Persistent Breakpoints
- Breakpoints are saved to
.vscode/dap-gui.breakpoints.json in your workspace
- On the next project open, they are restored automatically
File Reload
The code viewer always loads the latest file content from disk when you open a file. If you edit a file in an external editor while it's already open, click the Reload button in the editor toolbar to refresh the content.
Troubleshooting
- Adapter not found: Make sure to install the appropriate debug adapter for your language
- Breakpoints not hit: Check path mappings configuration. Variables such as
${workspaceFolder}, ${userHome}, ${workspaceFolderBasename}, and ${pathSeparator} are resolved against the opened workspace and system environment.
- File outside workspace cannot be opened: When debugging WordPress/Playground with separate core and plugin folders, make sure the more specific plugin mapping is listed before the broader WordPress core mapping, and that the local folders exist on disk.
- External editor not found: Make sure the editor is on your PATH, or use the full path in the Custom editor setting
License
MIT