OpenObserve is a cloud-native observability platform designed to simplify log, metric, trace, and analytics management. Built as an alternative to Elasticsearch, Splunk, and Datadog, OpenObserve offers a high-performance, cost-effective solution with petabyte-scale capabilities.
Key Features:
Comprehensive Observability: Supports logs, metrics, traces, RUM (Real User Monitoring), error tracking, and session replay.
OpenTelemetry Integration: Fully compatible with OTLP for seamless collection of distributed tracing data.
Advanced Visualization: Features over 18 chart types for dashboards, reports, and alerts to enable deep insights.
Stream Processing Pipelines: Enables enrichment, redaction, normalization, and transformation of data on the fly.
SQL and PromQL Querying: Supports log and trace querying with SQL and metrics analysis with SQL and PromQL.
Versatile Storage Options: Supports local disk, S3, MinIO, GCS, Azure Blob Storage for flexible deployment needs.
Audience & Benefit:
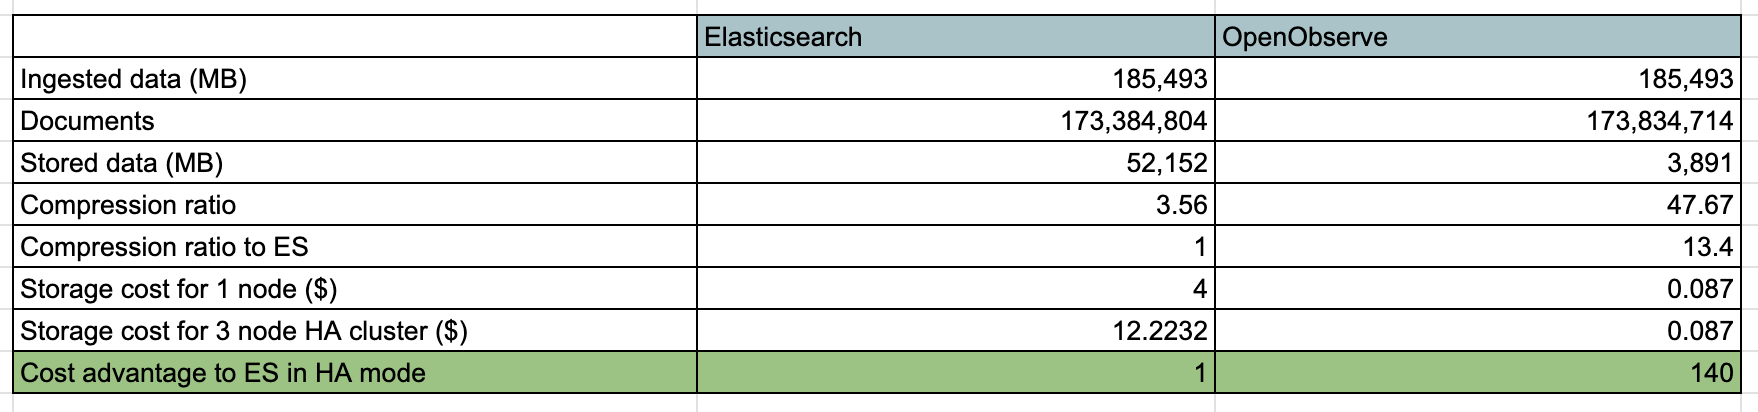
Ideal for DevOps engineers, site reliability engineers (SREs), and developers who need a scalable observability solution. OpenObserve reduces storage costs by up to 140x compared to Elasticsearch while offering superior performance and ease of use. Its intuitive UI eliminates the need for complex configurations, making it faster to deploy and simpler to operate than traditional alternatives.
Installable via winget, OpenObserve provides a straightforward path to achieving modern observability at scale without the complexity of legacy systems.
README
Open source Datadog alternative for logs, metrics, traces, and frontend monitoring. Modern observability platform: 10x easier, 140x lower storage cost, high performance, petabyte scale.
OpenObserve (O2) is a cloud-native observability platform for logs, metrics, traces, analytics, Real User Monitoring (RUM), and AI/LLM observability. It's a cost-effective alternative to Datadog, Splunk, and Elasticsearch for teams that need full observability without the complexity or cost — with Parquet columnar storage and an S3-native design that cuts storage costs by up to 140x.
OpenObserve ships with a powerful, unified web UI for every signal — logs, traces, metrics, dashboards, RUM, alerts, incidents, pipelines, and AI observability.
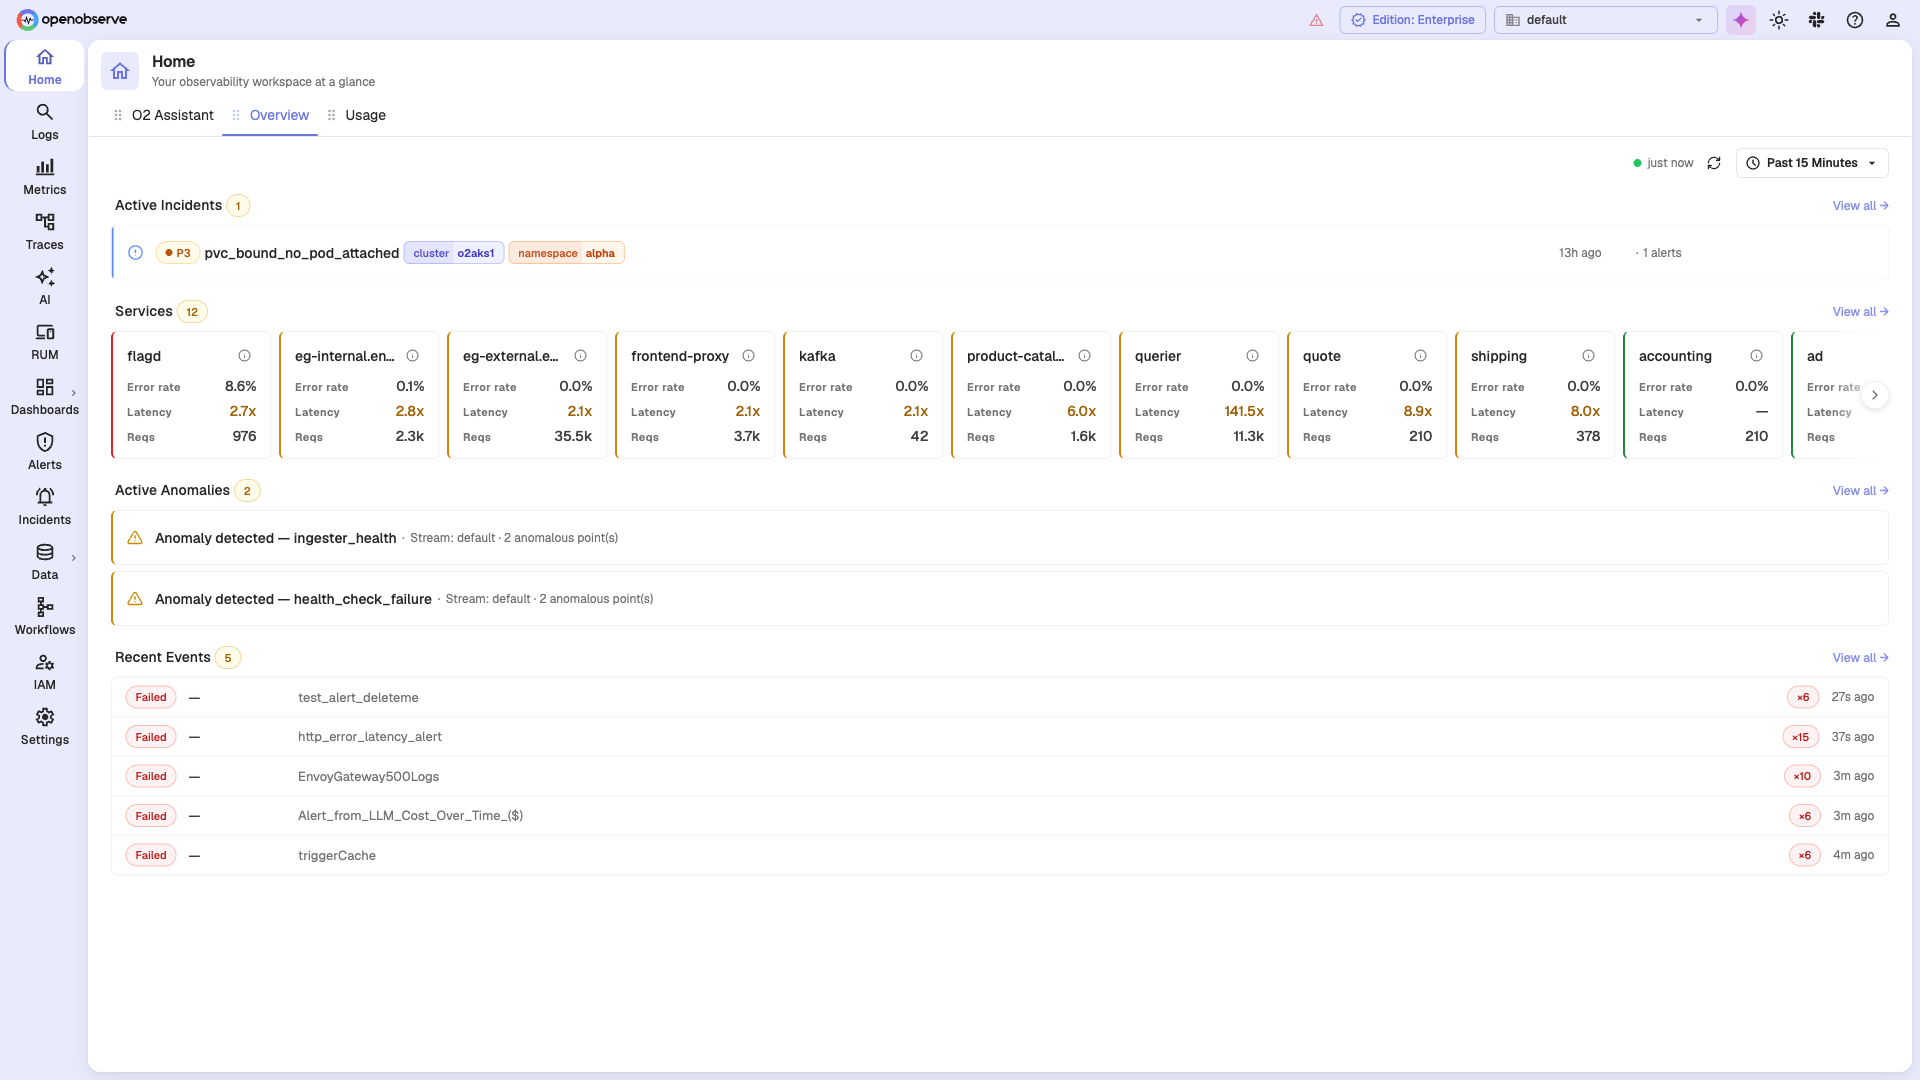
🏠 Unified Overview
A single home for your workspace — active incidents, service health (error rate, latency, requests), anomalies, and recent events at a glance.
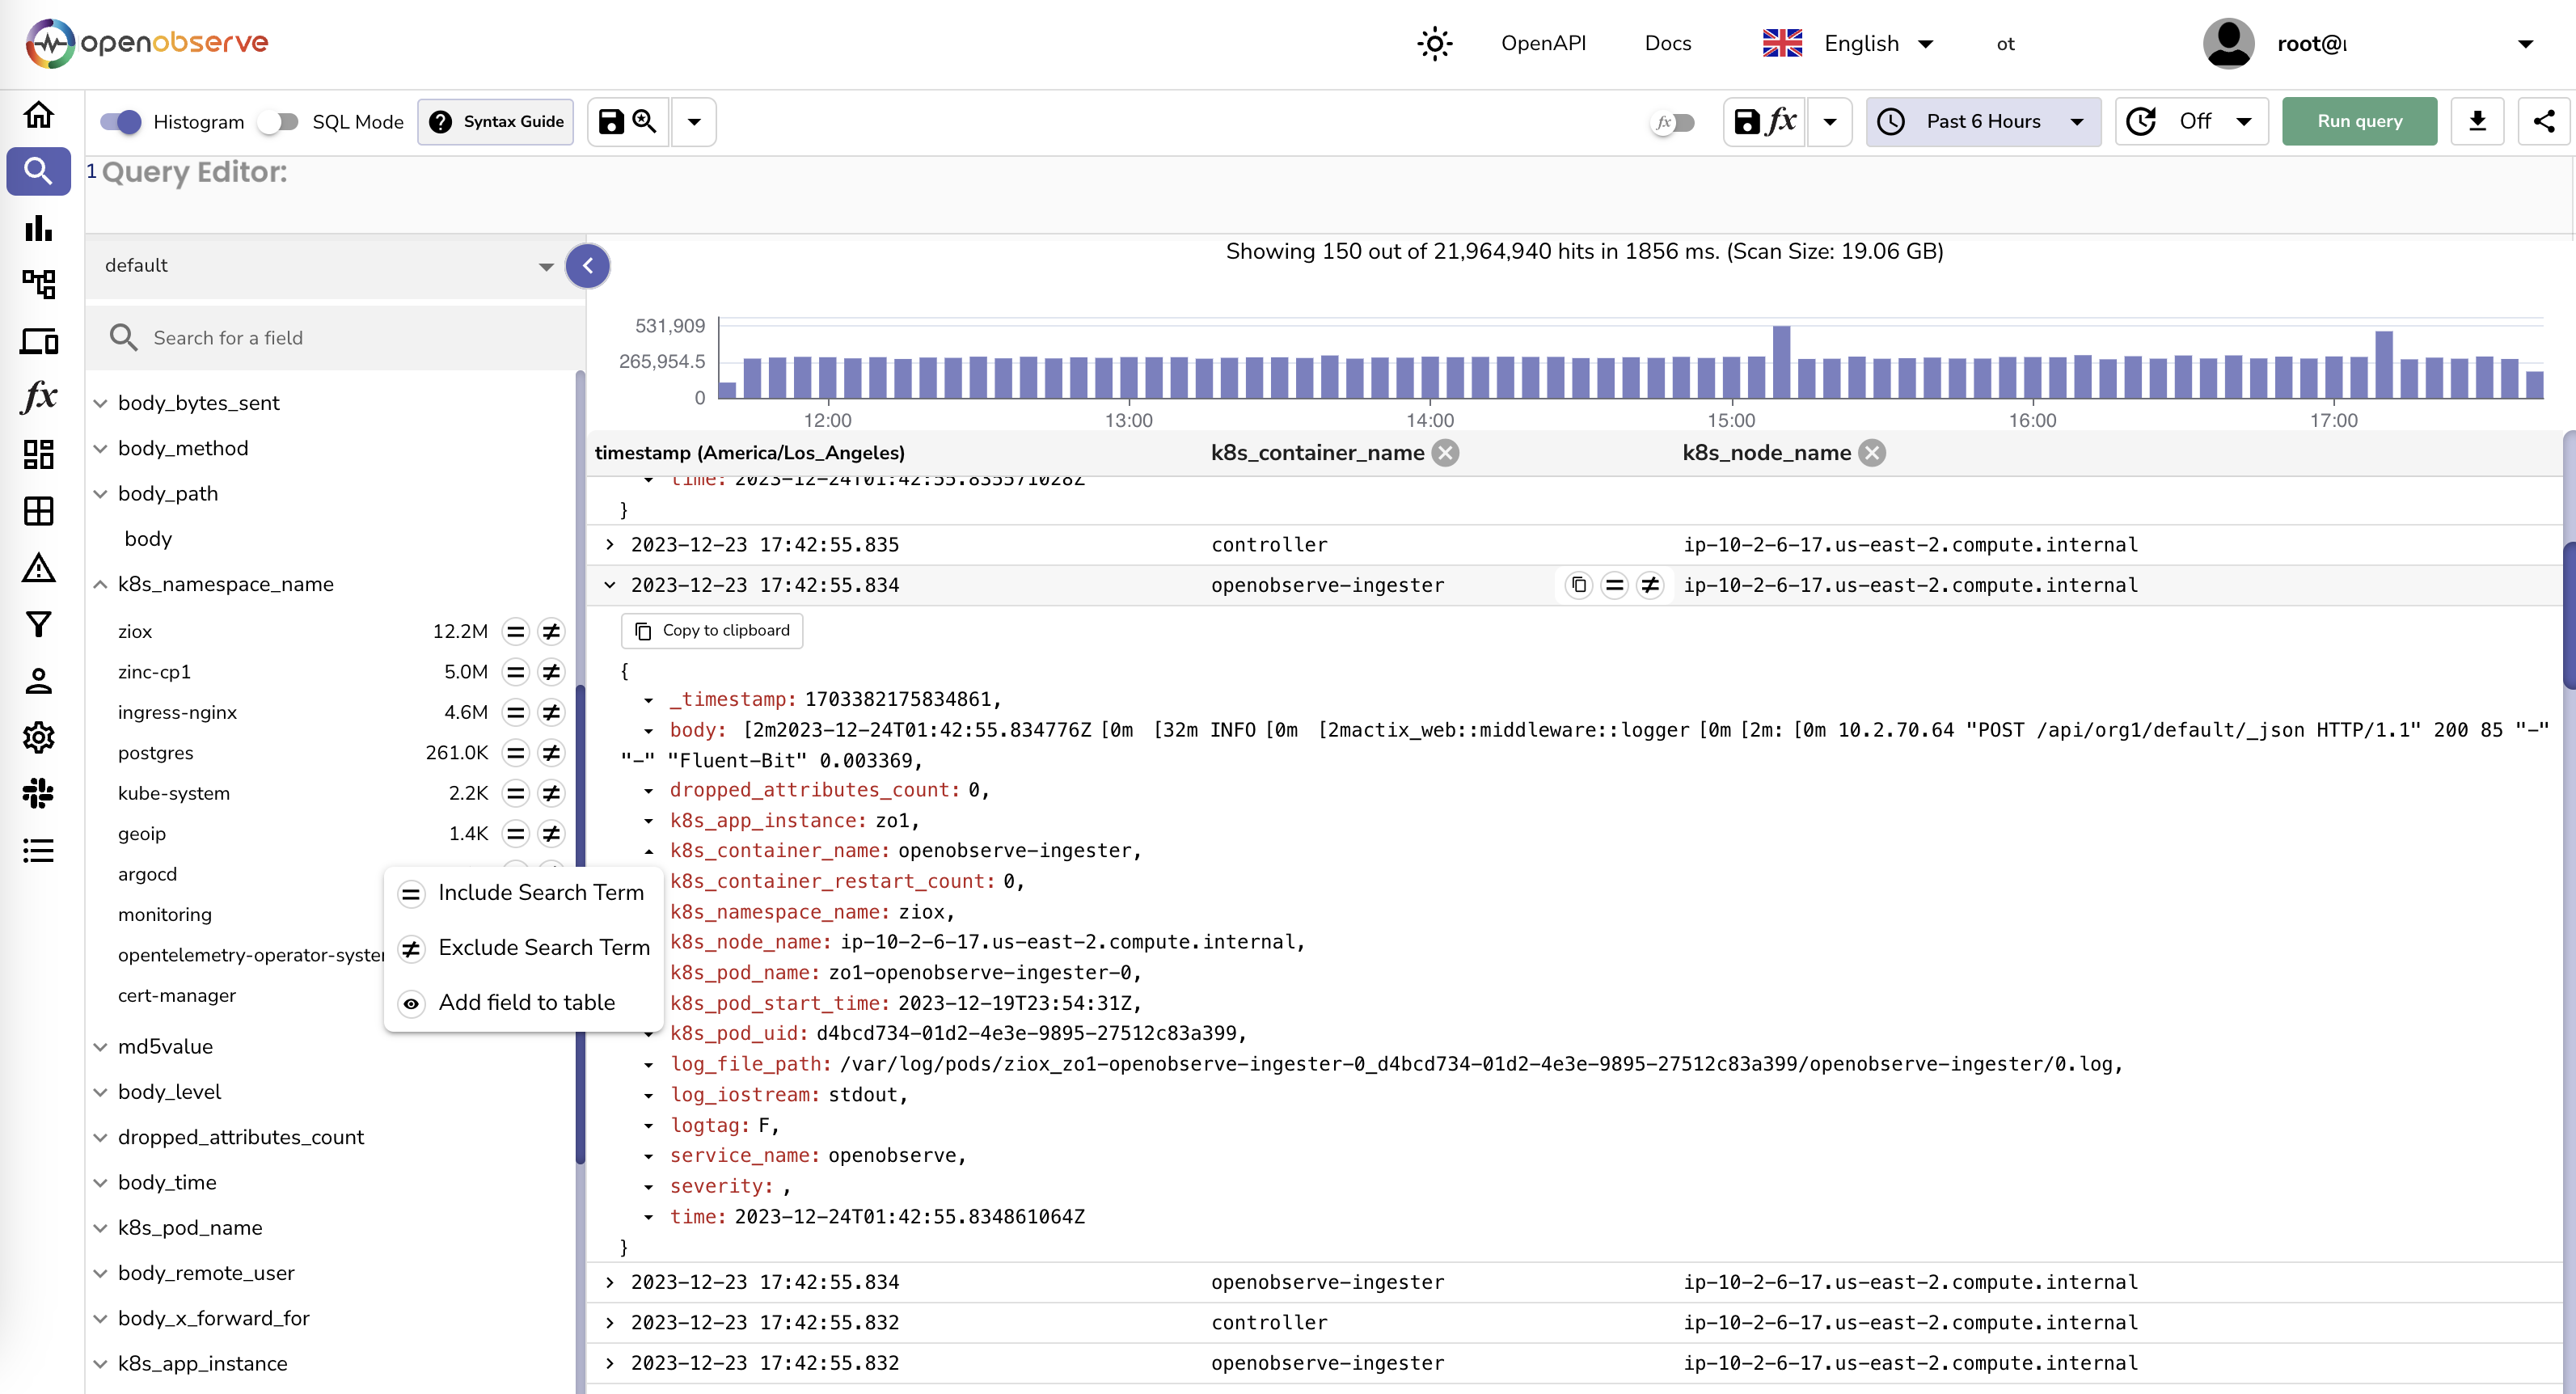
📊 Logs
Centralized log management with full-text search, SQL queries, quick filters, and a visual query builder. Instantly search across all your logs, build dashboards from log data, and set up alerts — all on Parquet columnar storage for 140x lower storage cost than Elasticsearch. Read more →
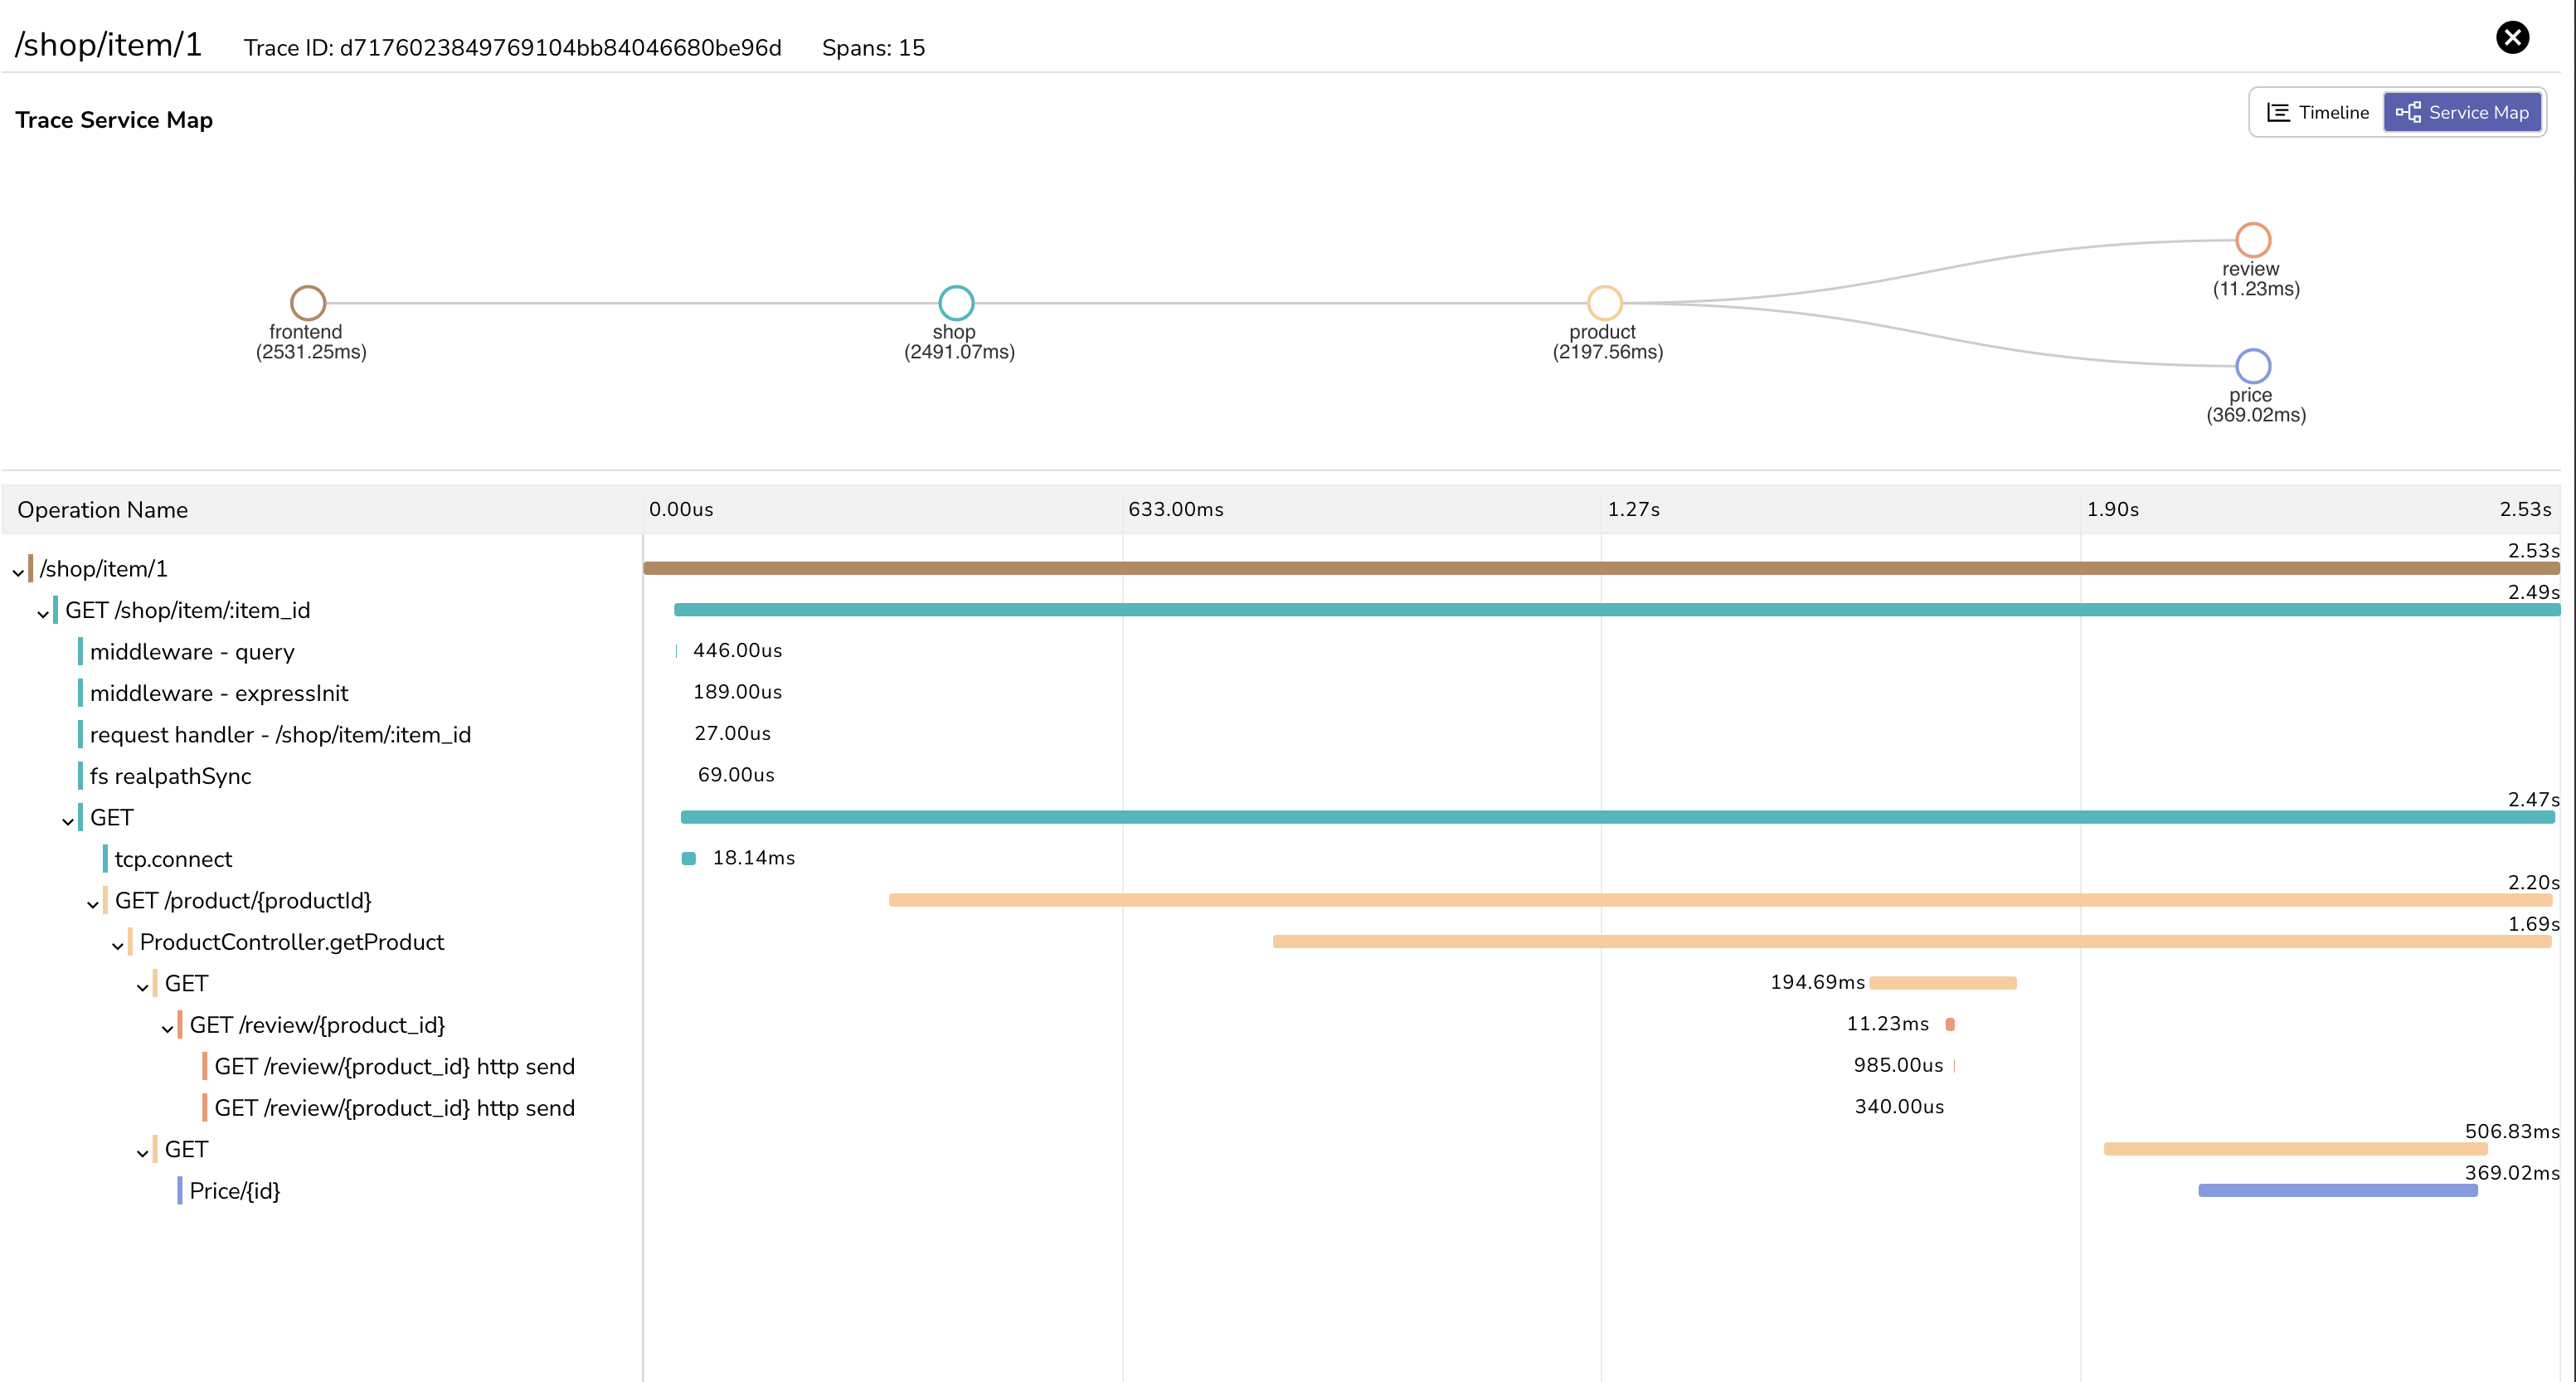
🔍 Distributed Tracing
Powered by OpenTelemetry, tracing helps you follow requests across services and pinpoint performance bottlenecks. Explore the full request flow with waterfalls, flame graphs, and Gantt charts; click any span to drill into the trace. Read more →
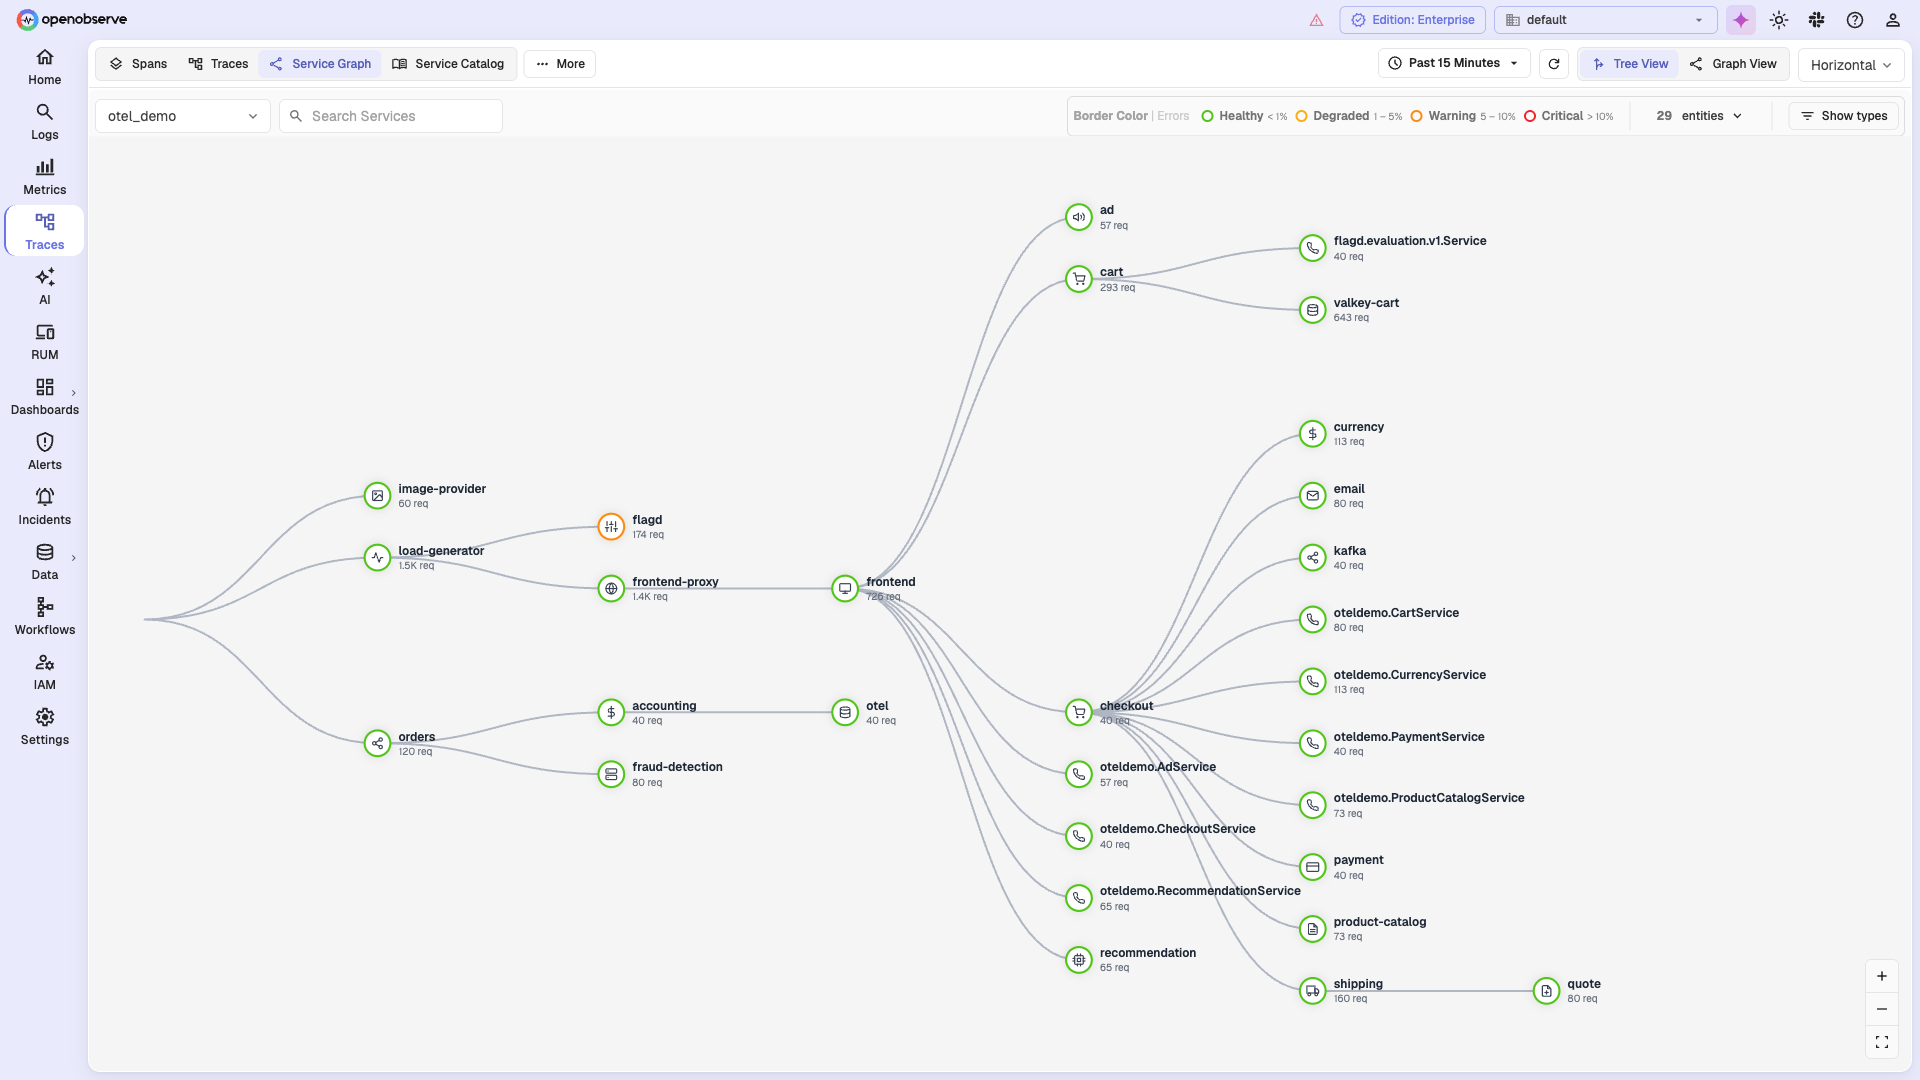
🕸️ Service Graph
Visualize service-to-service dependencies and request flow across your system, with per-edge request counts and health-based coloring (healthy, degraded, warning, critical) to spot problem hotspots at a glance.
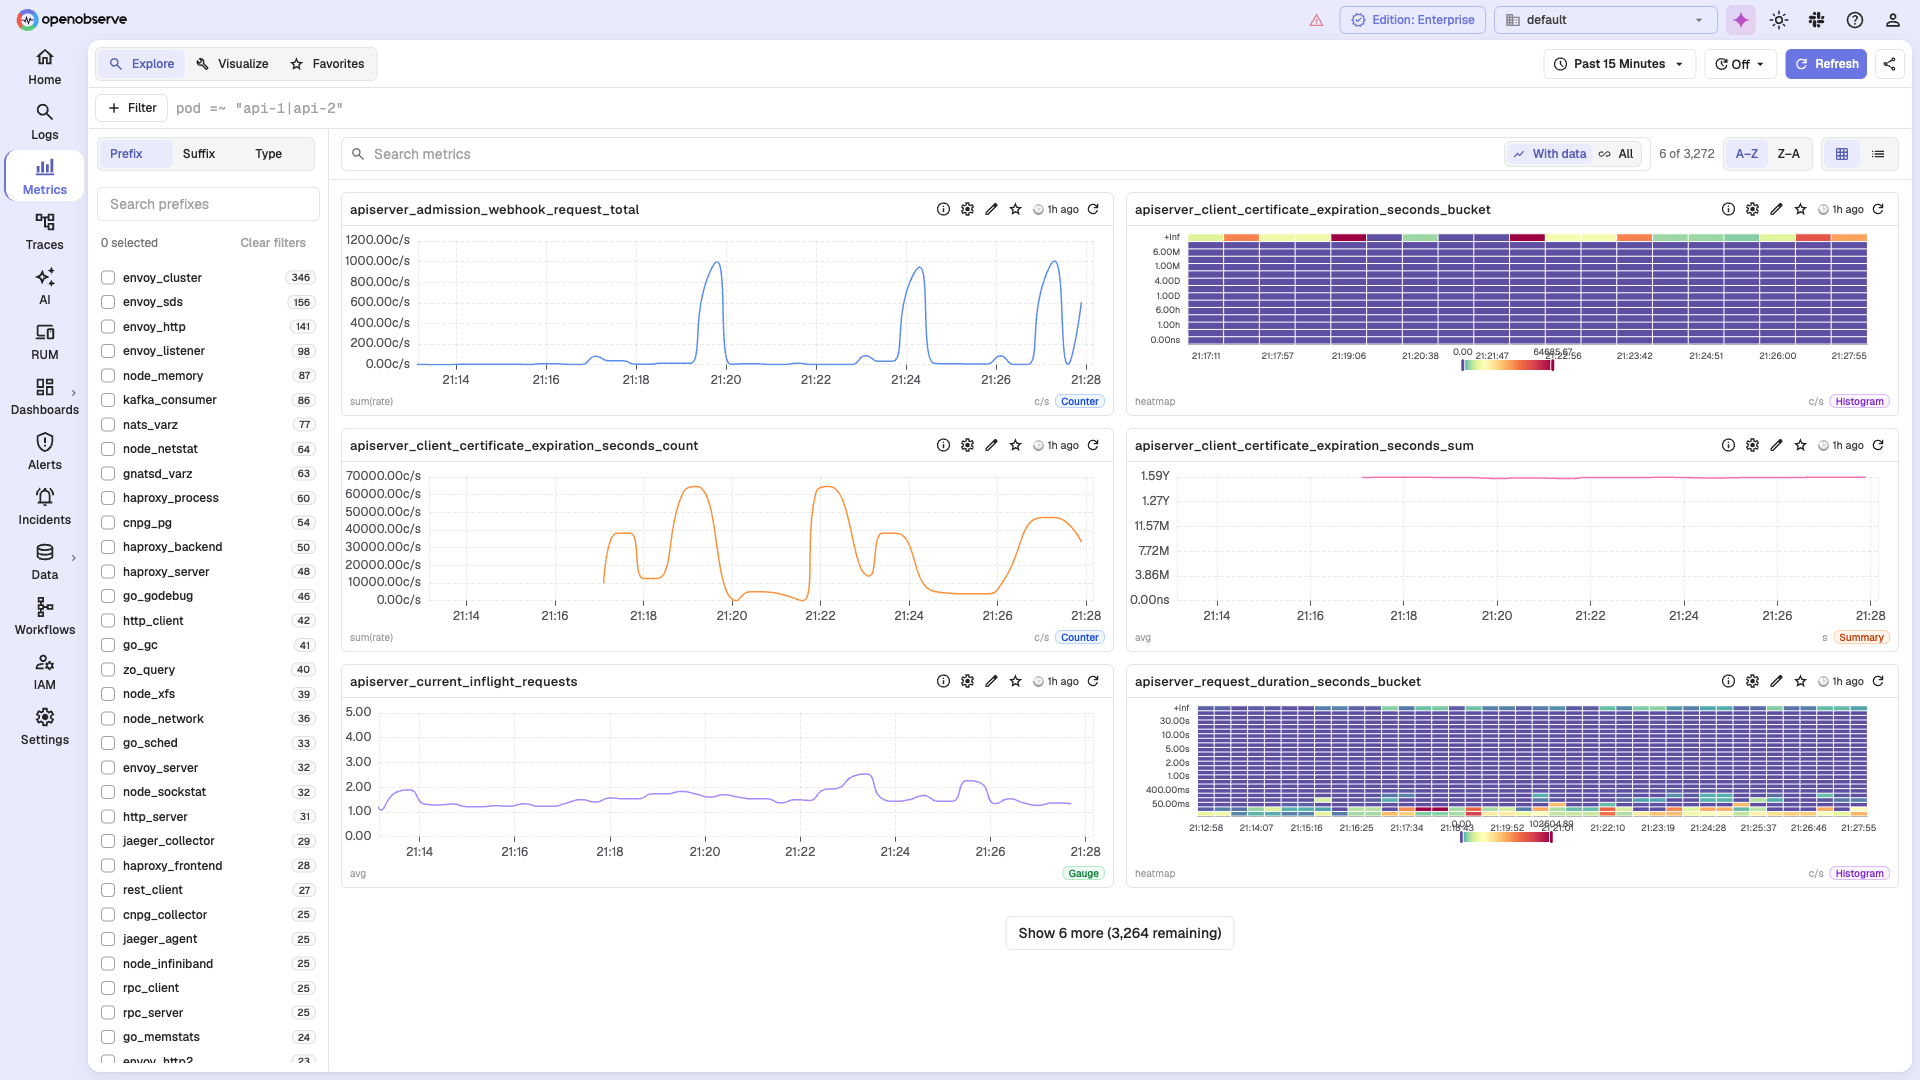
📈 Metrics
Explore metrics from your infrastructure and applications, then query them with SQL or PromQL. Browse thousands of metrics with faceted filters, preview them inline, combine multiple queries with formulae, and visualize the results with 19+ chart types. Read more →
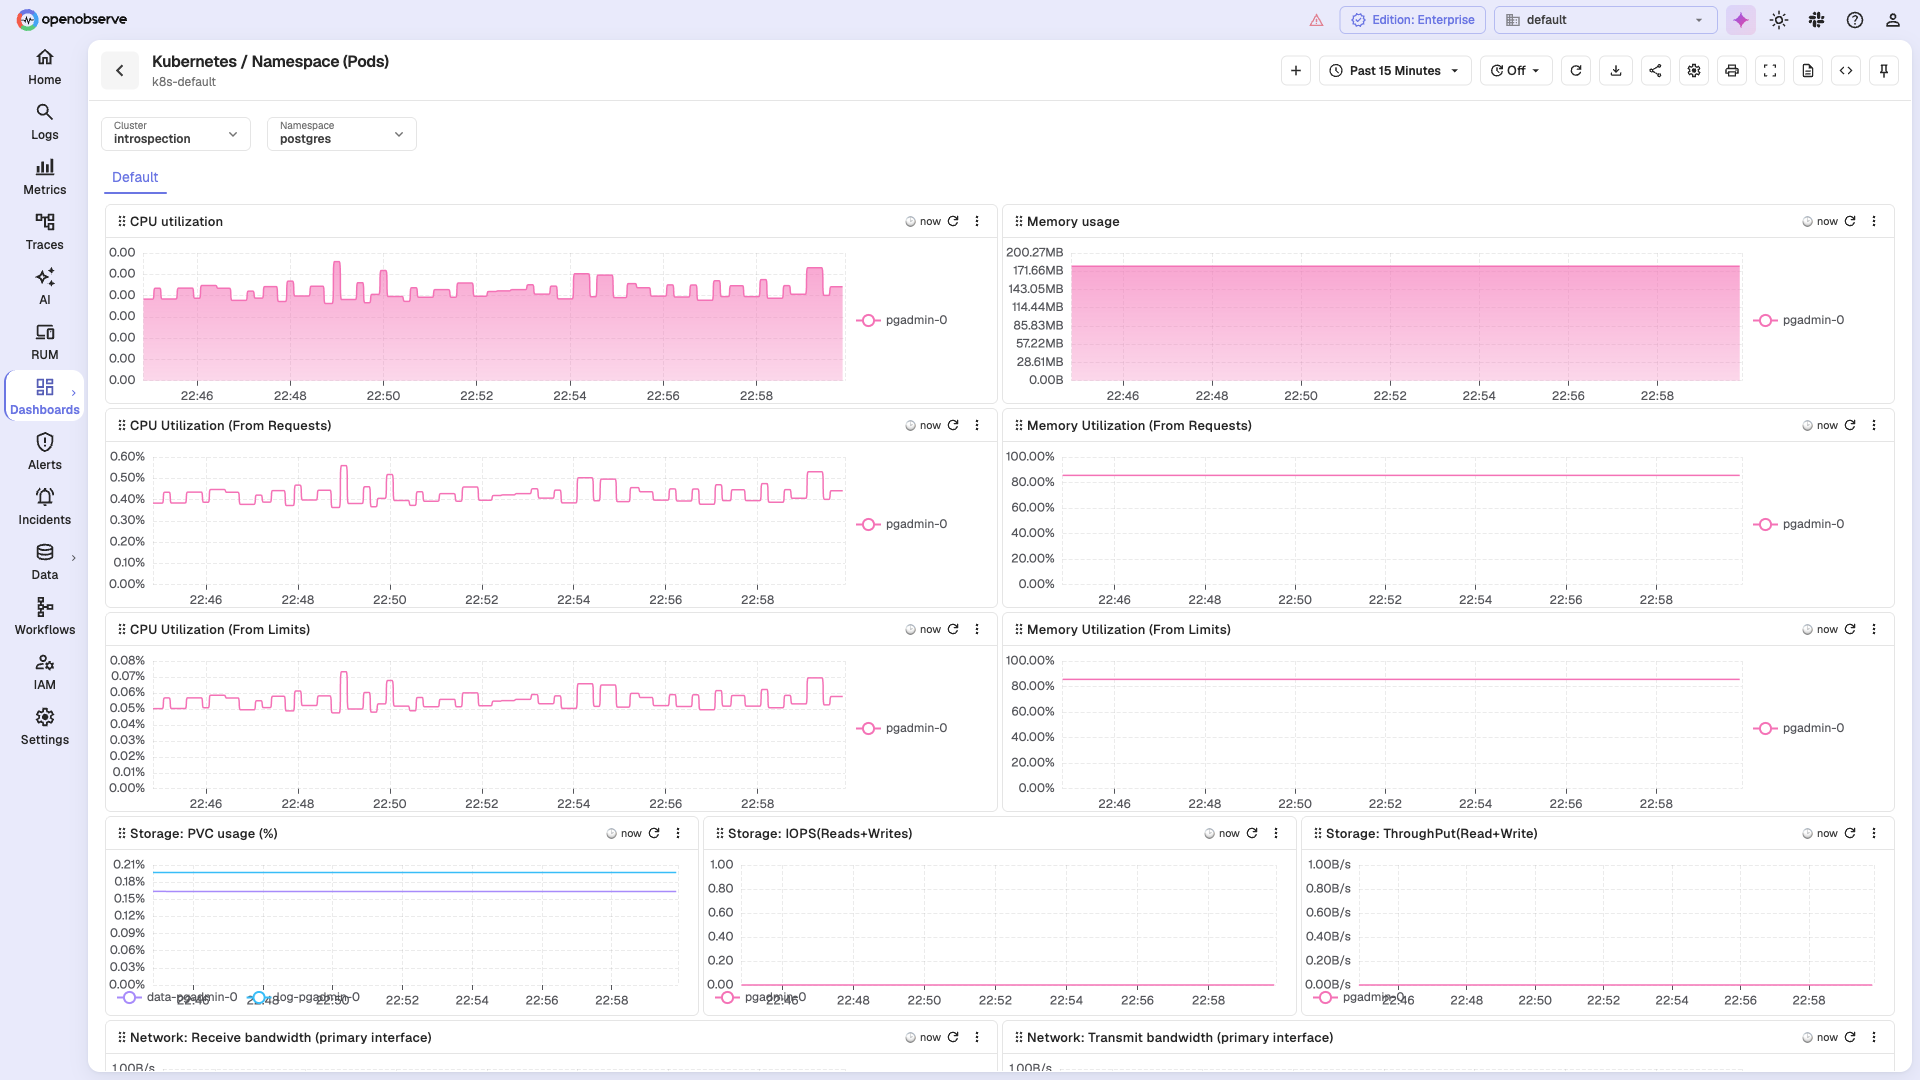
📉 Dashboards
Build custom dashboards from any signal with 19+ built-in chart types and 200+ visualization variations, a drag-and-drop panel builder, template variables, and geo maps. Read more →
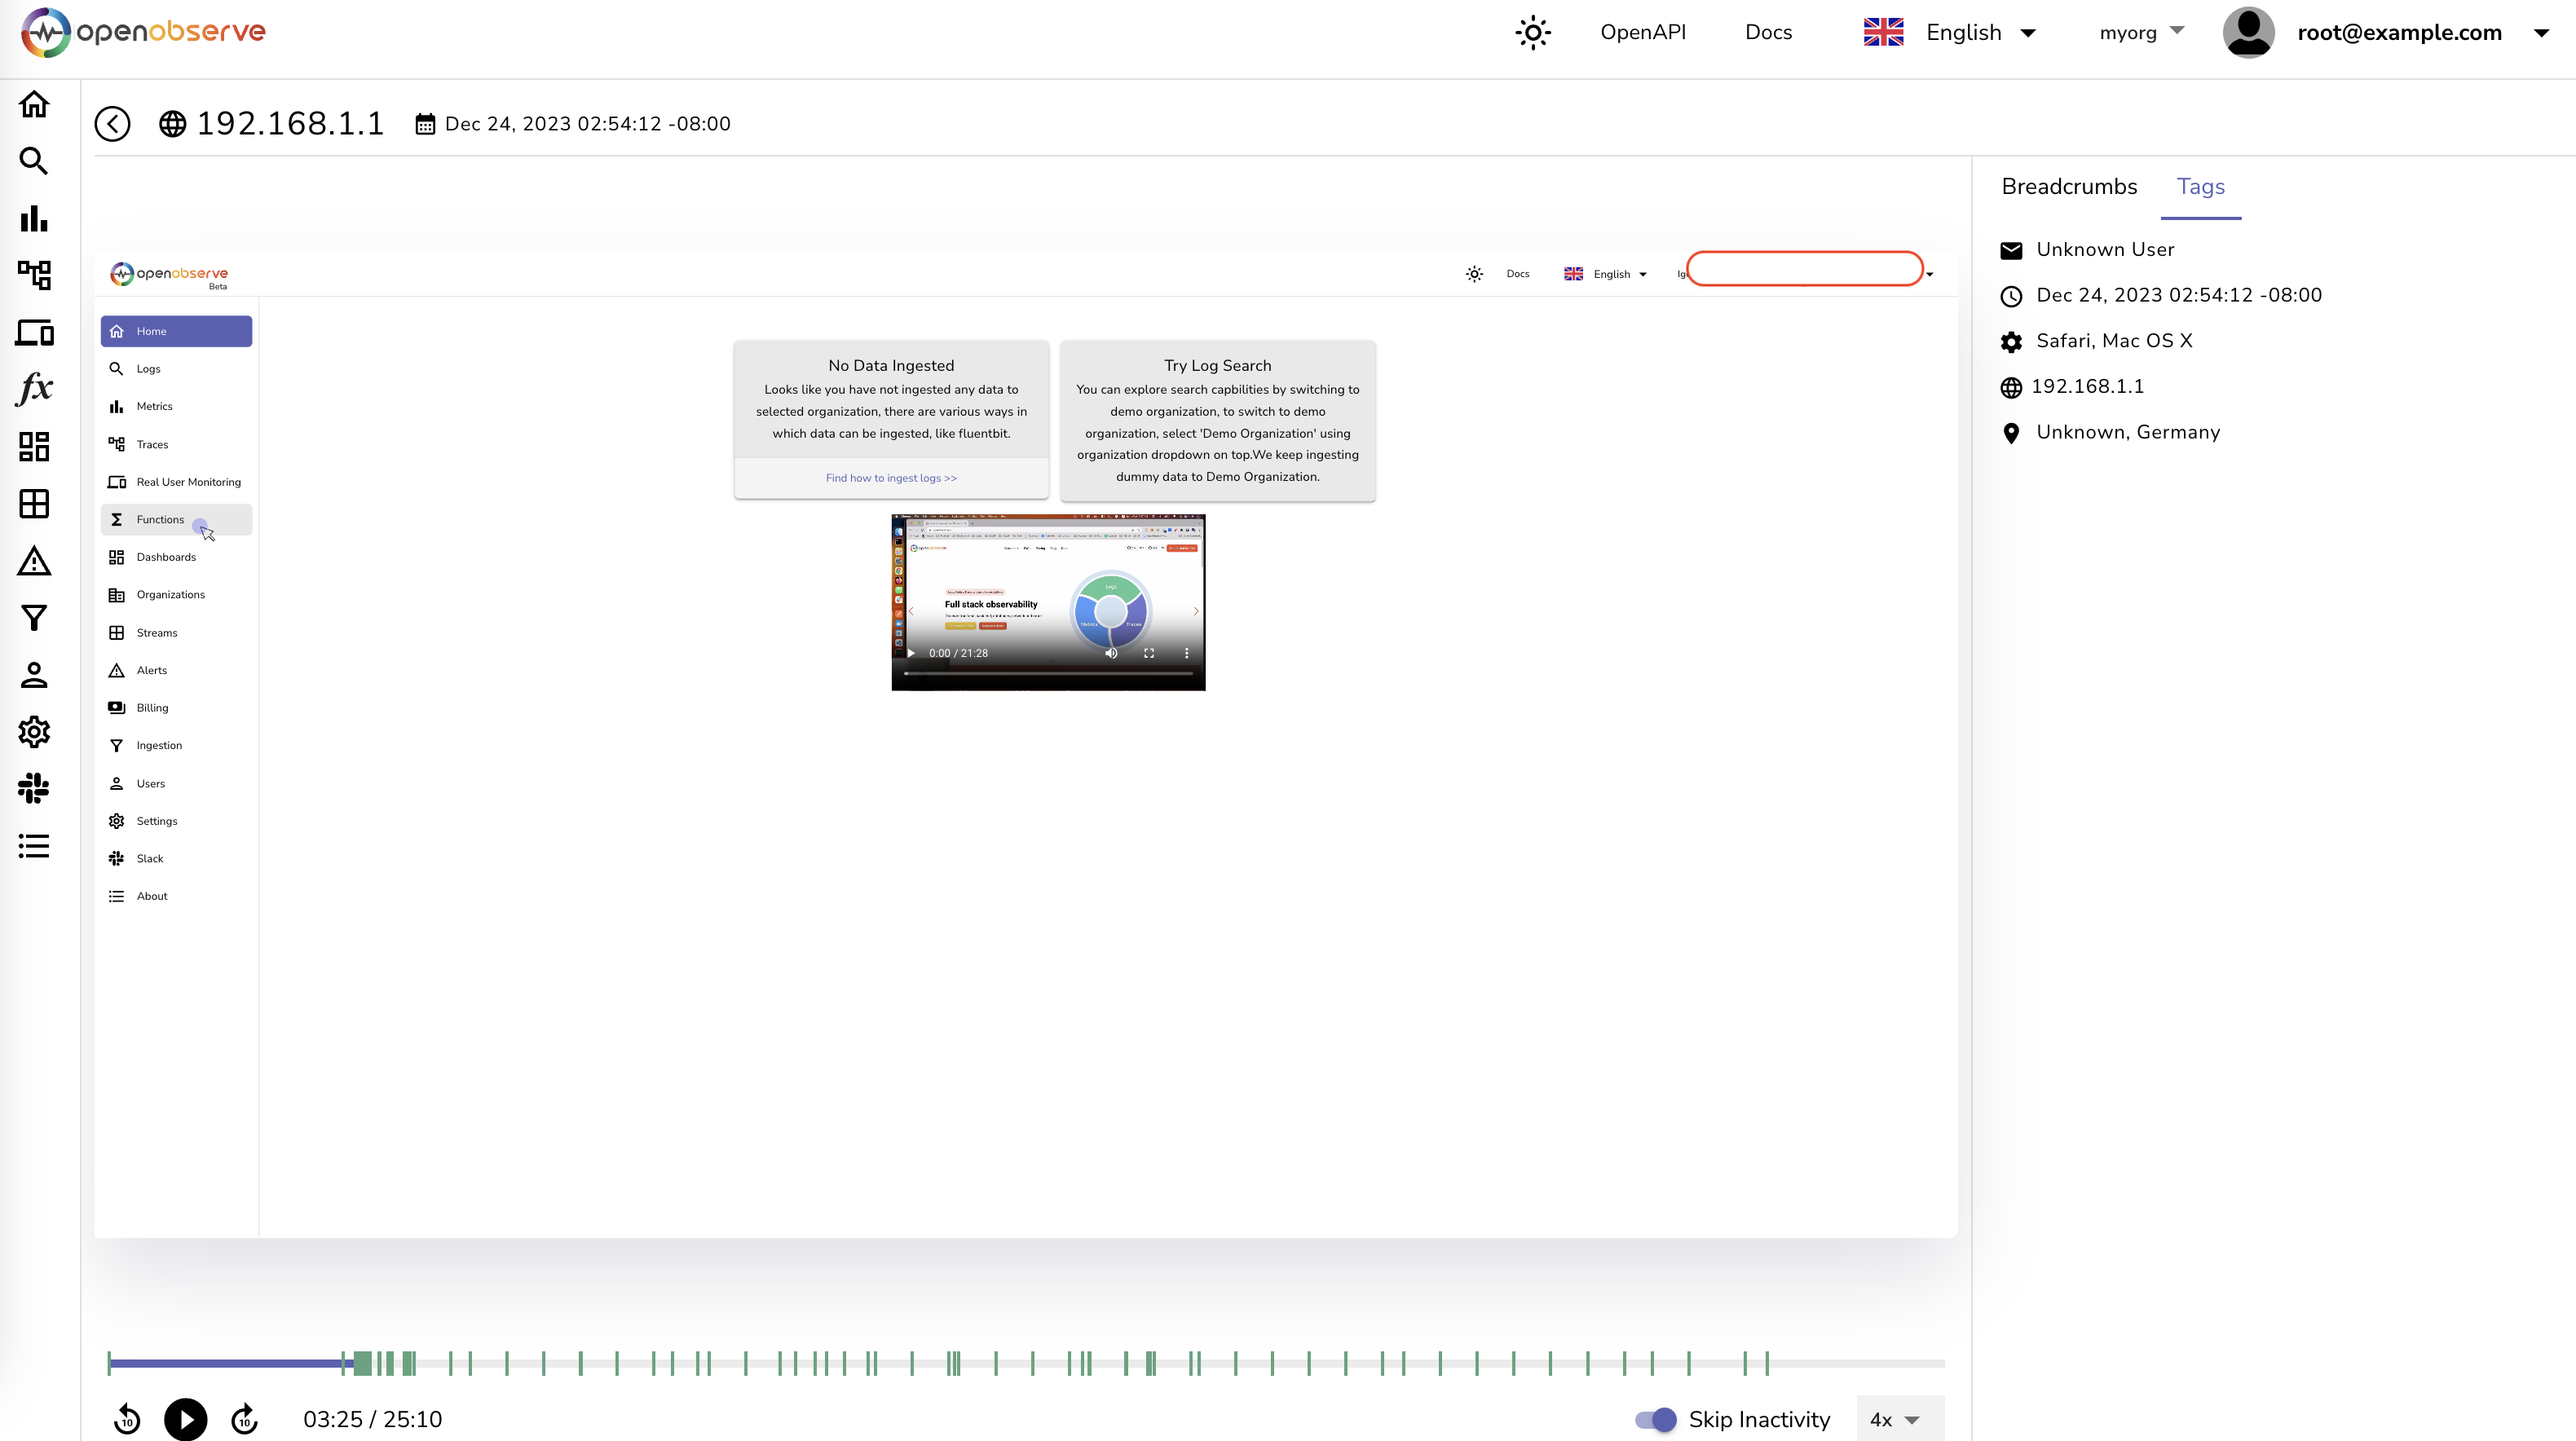
👀 Frontend Monitoring (RUM)
Real User Monitoring with Core Web Vitals, error tracking, performance analytics, and full session replay — so you can see exactly what your users experience. Read more →
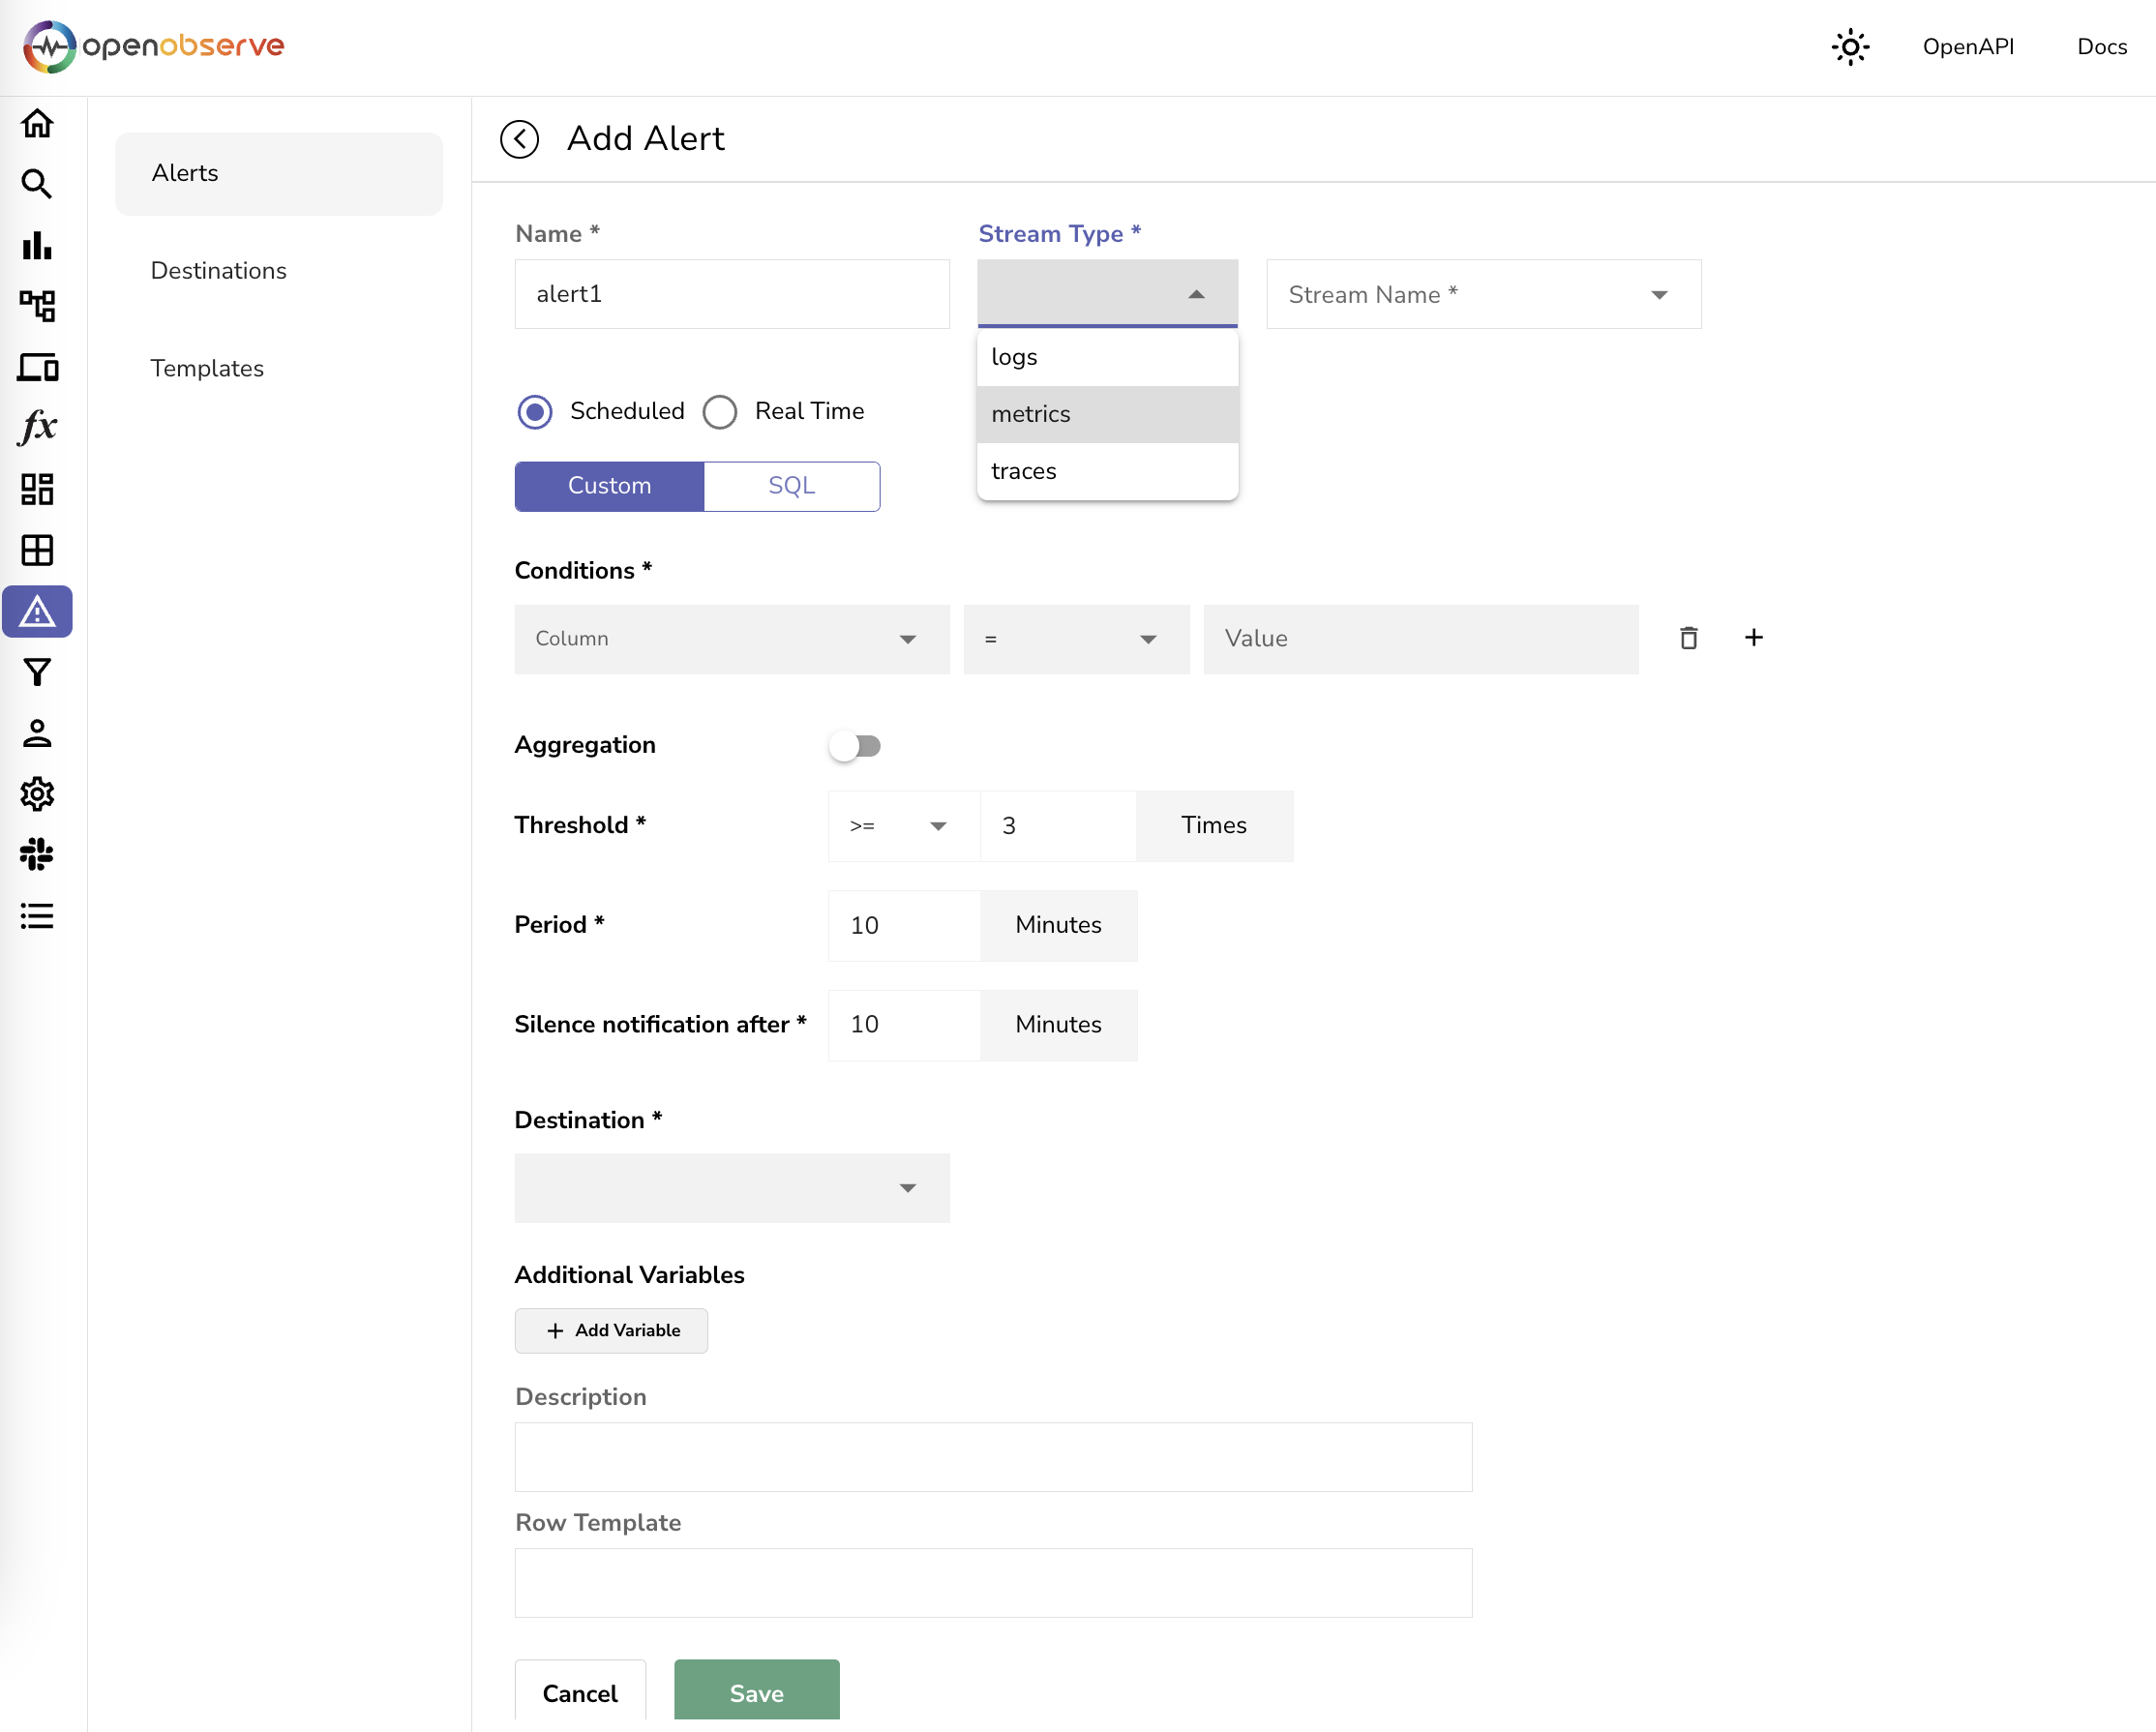
🔔 Alerts
Get notified when something unusual happens on any signal — logs, metrics, or traces. Define thresholds, scheduled or real-time alerts, and notification channels, with alert history and anomaly detection to catch issues early. Read more →
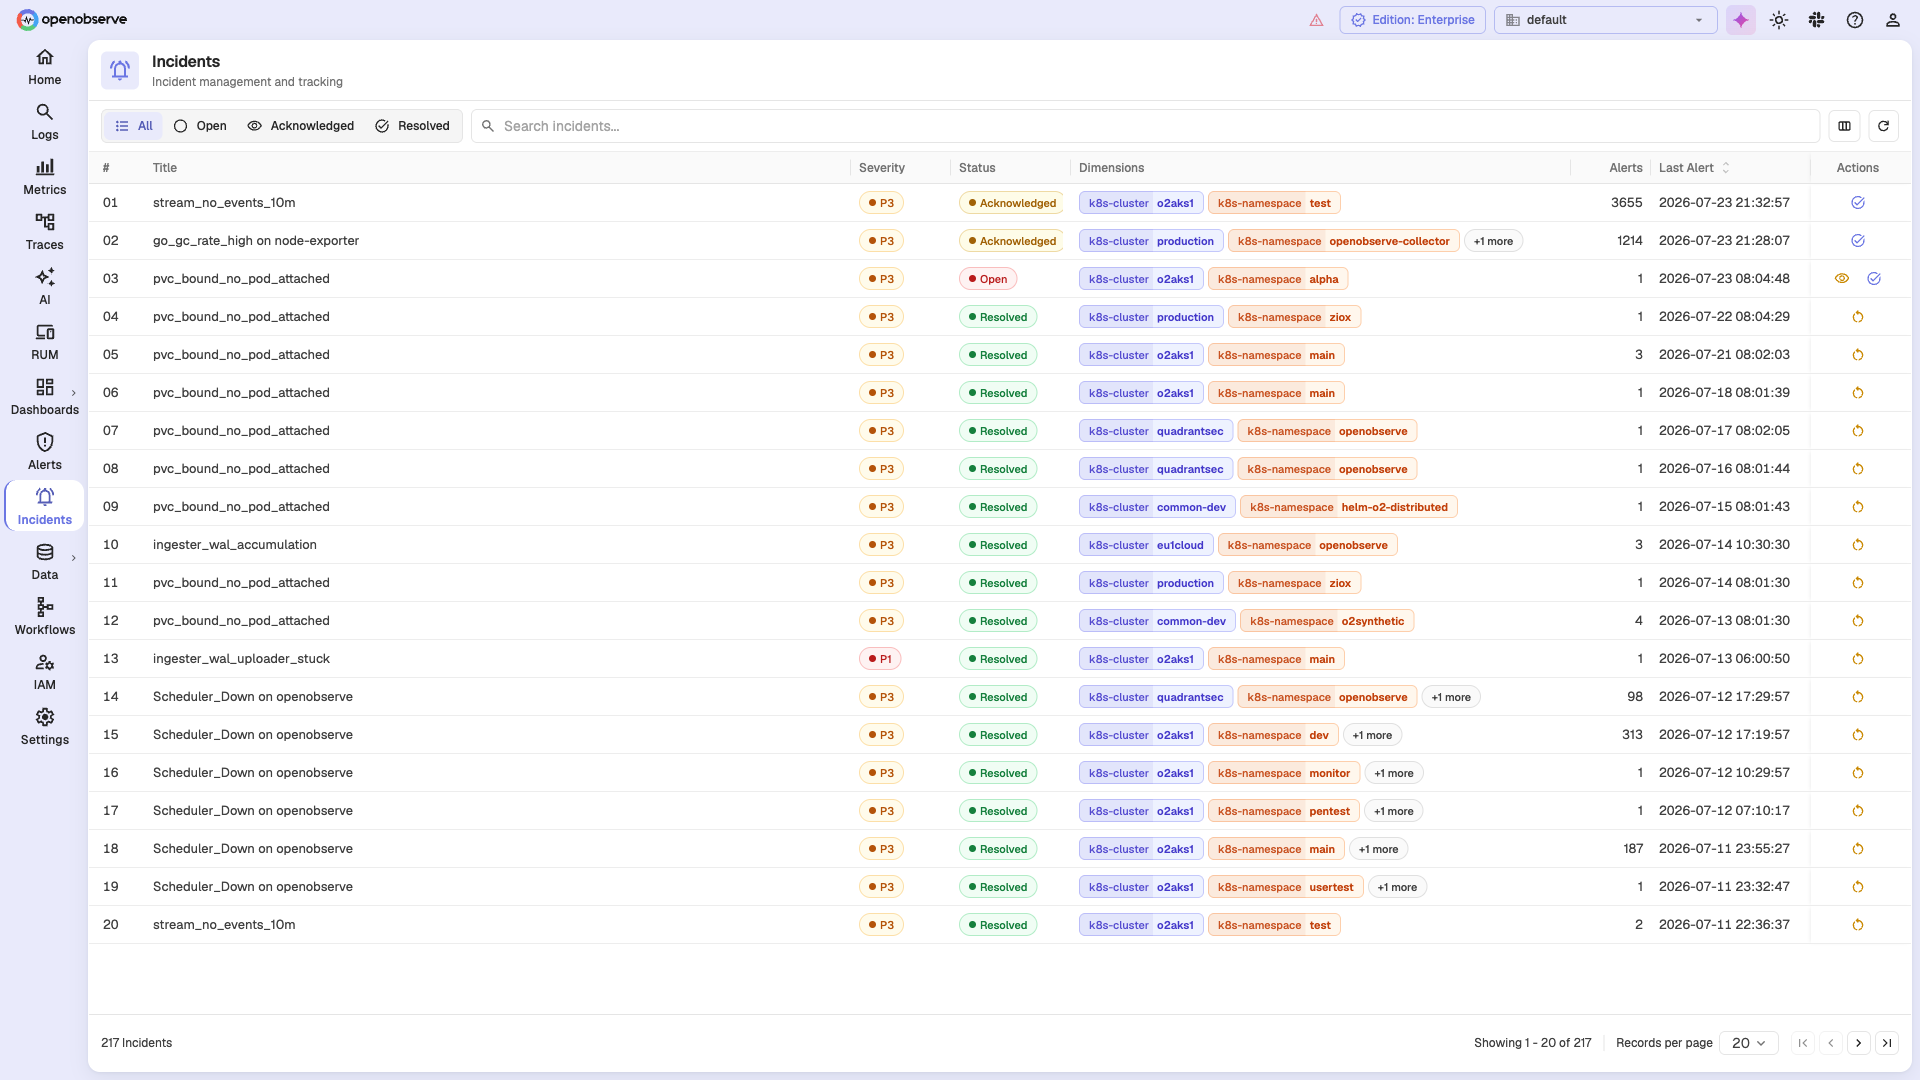
🚨 Incidents
Correlate related alerts into incidents and track them through their lifecycle — open, acknowledged, and resolved — with severity and dimension context for faster response.
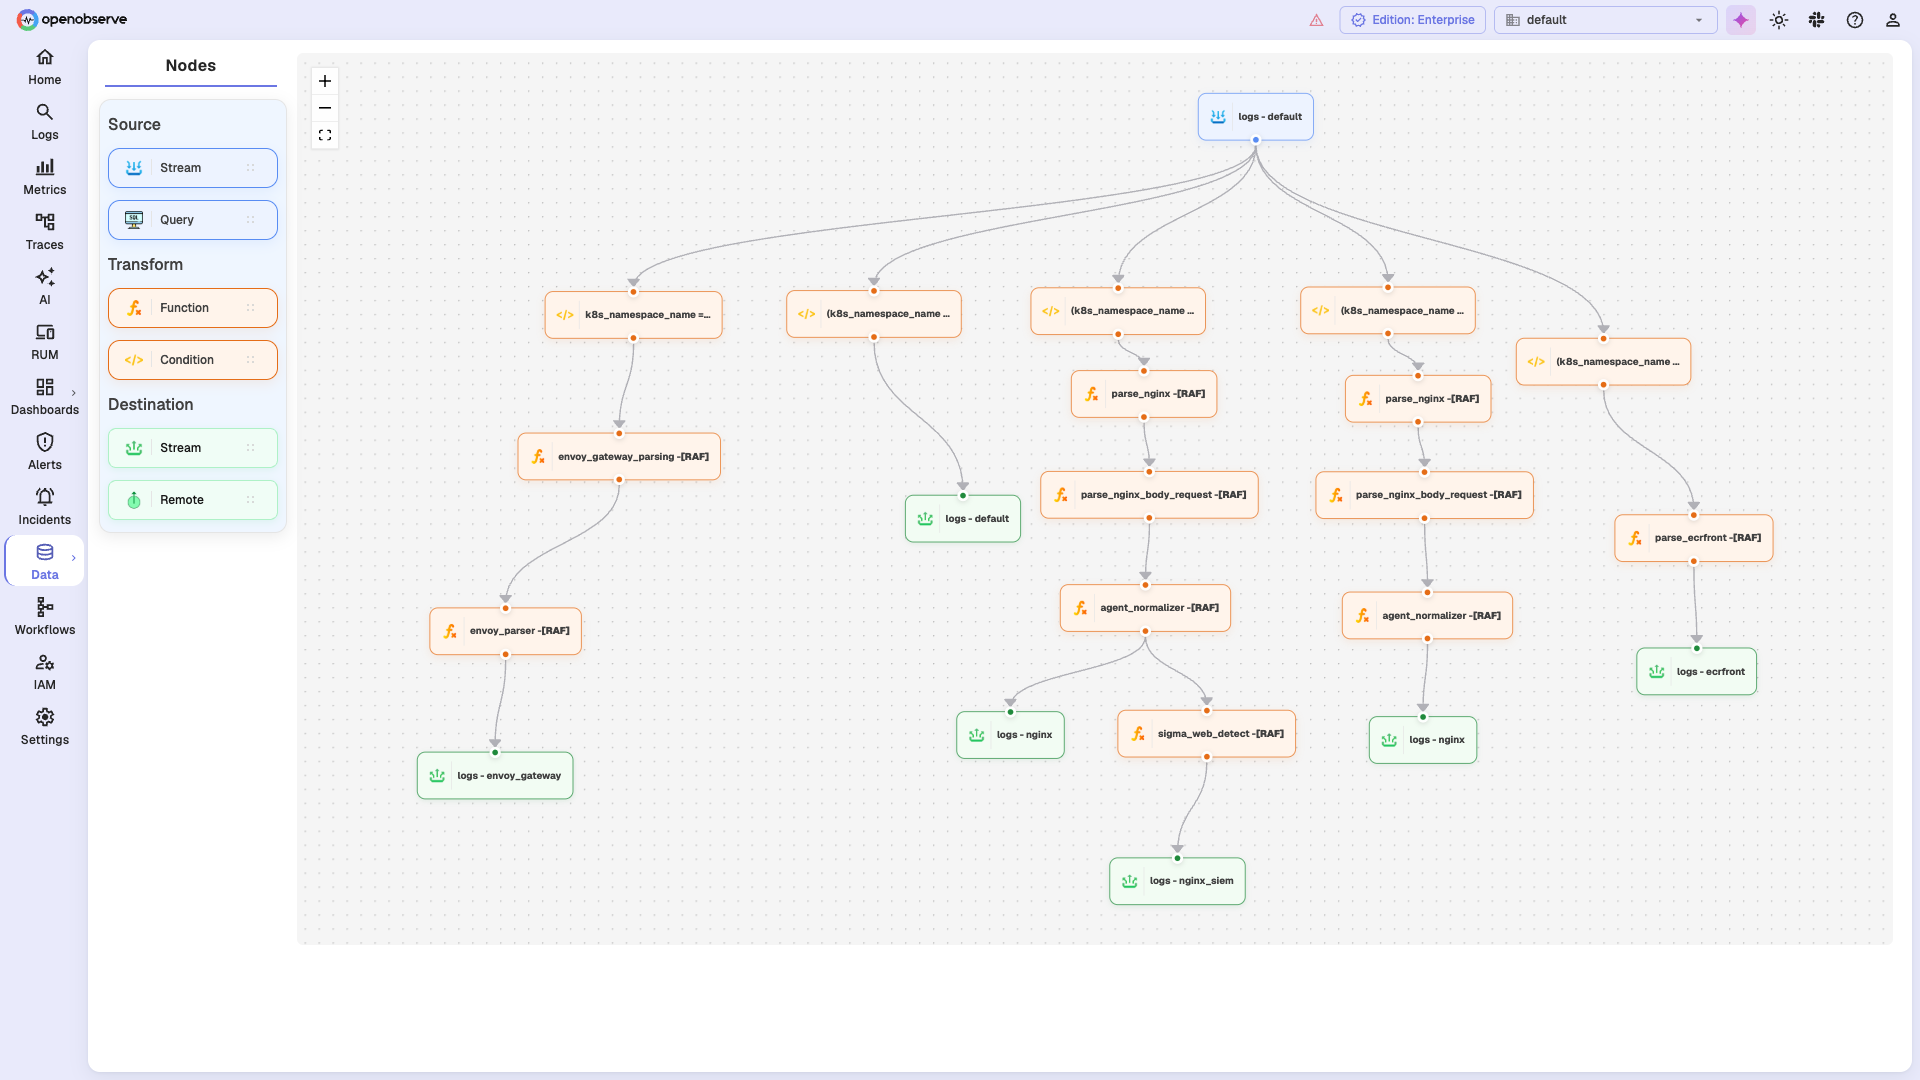
🔀 Pipelines
Enrich, redact, reduce, or normalize data at ingest time with a visual editor. Build stream-processing flows — including logs-to-metrics conversion — from source, transform (VRL functions and conditions), and destination nodes. No external tools required. Read more →
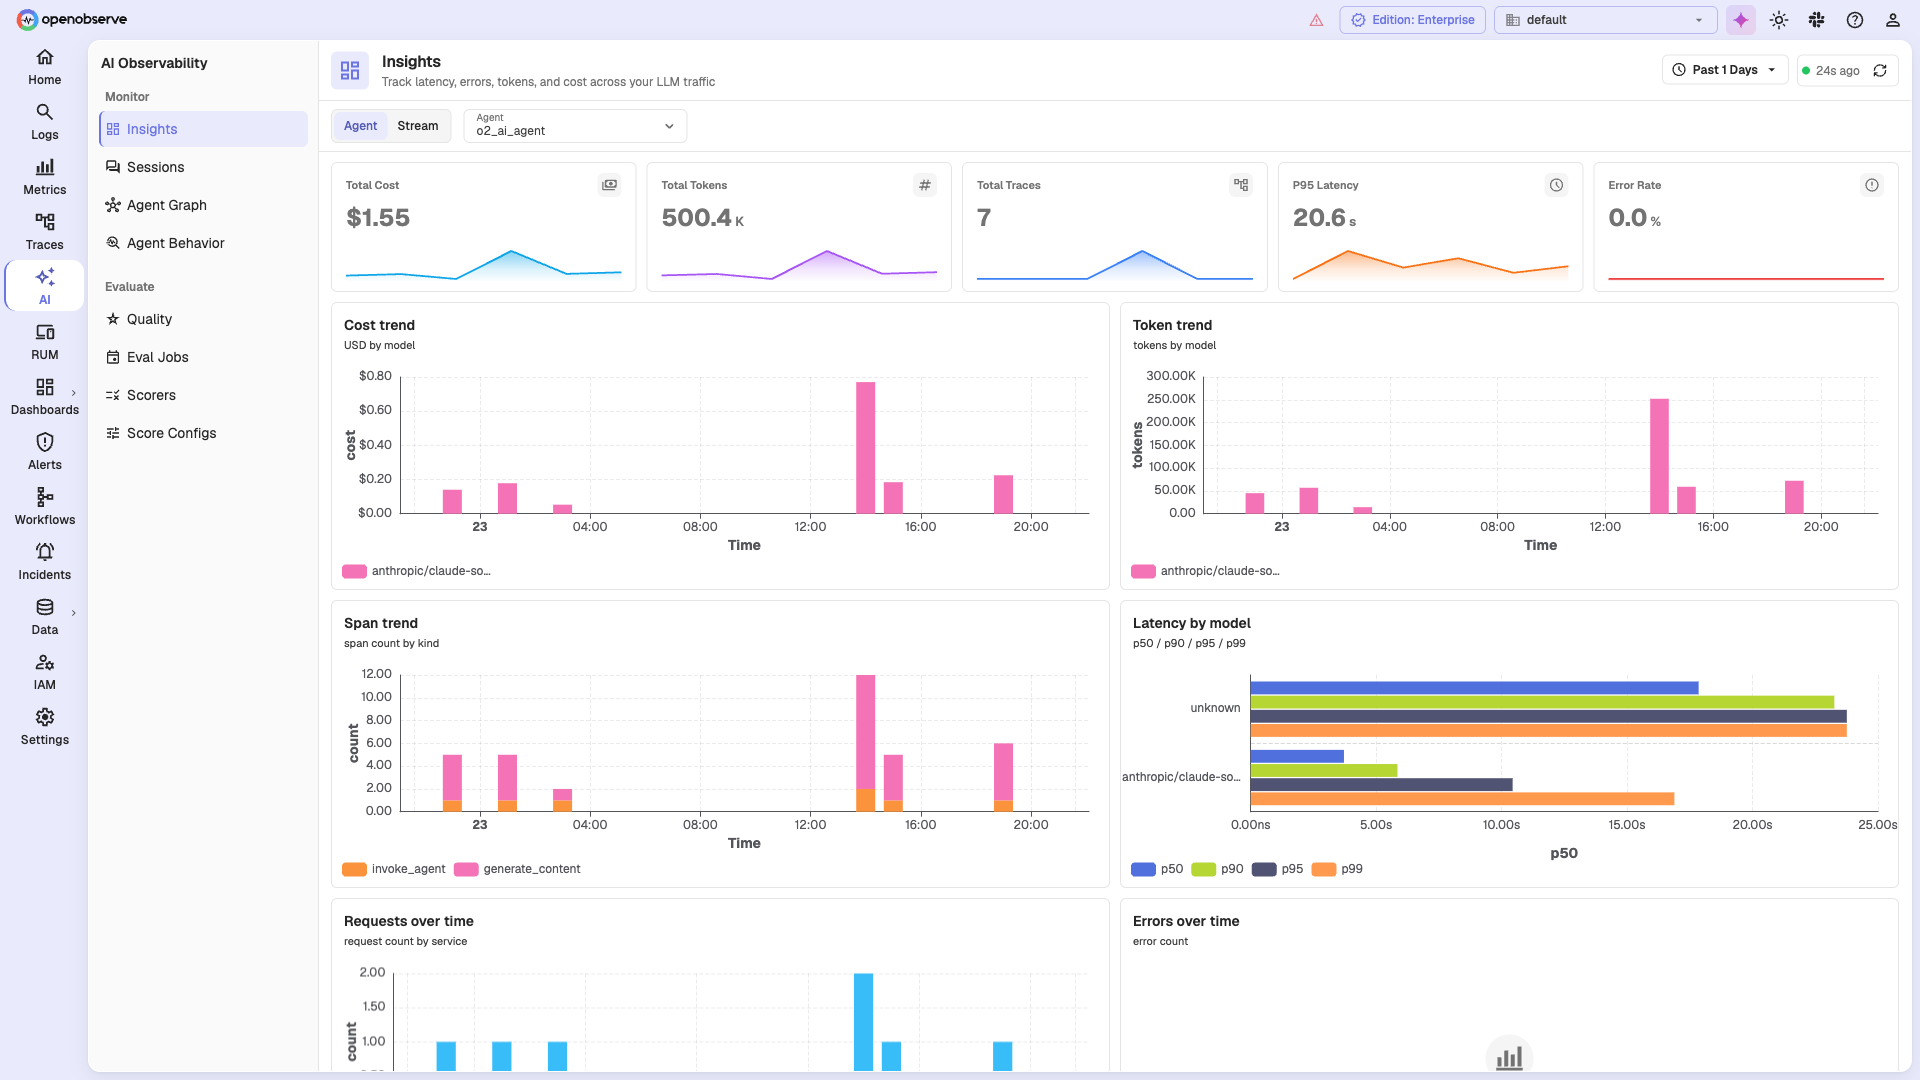
🤖 AI Observability
Monitor your GenAI and LLM applications: track cost, tokens, latency percentiles, and error rates across models, with agent graphs, session traces, and evaluation/quality scoring.
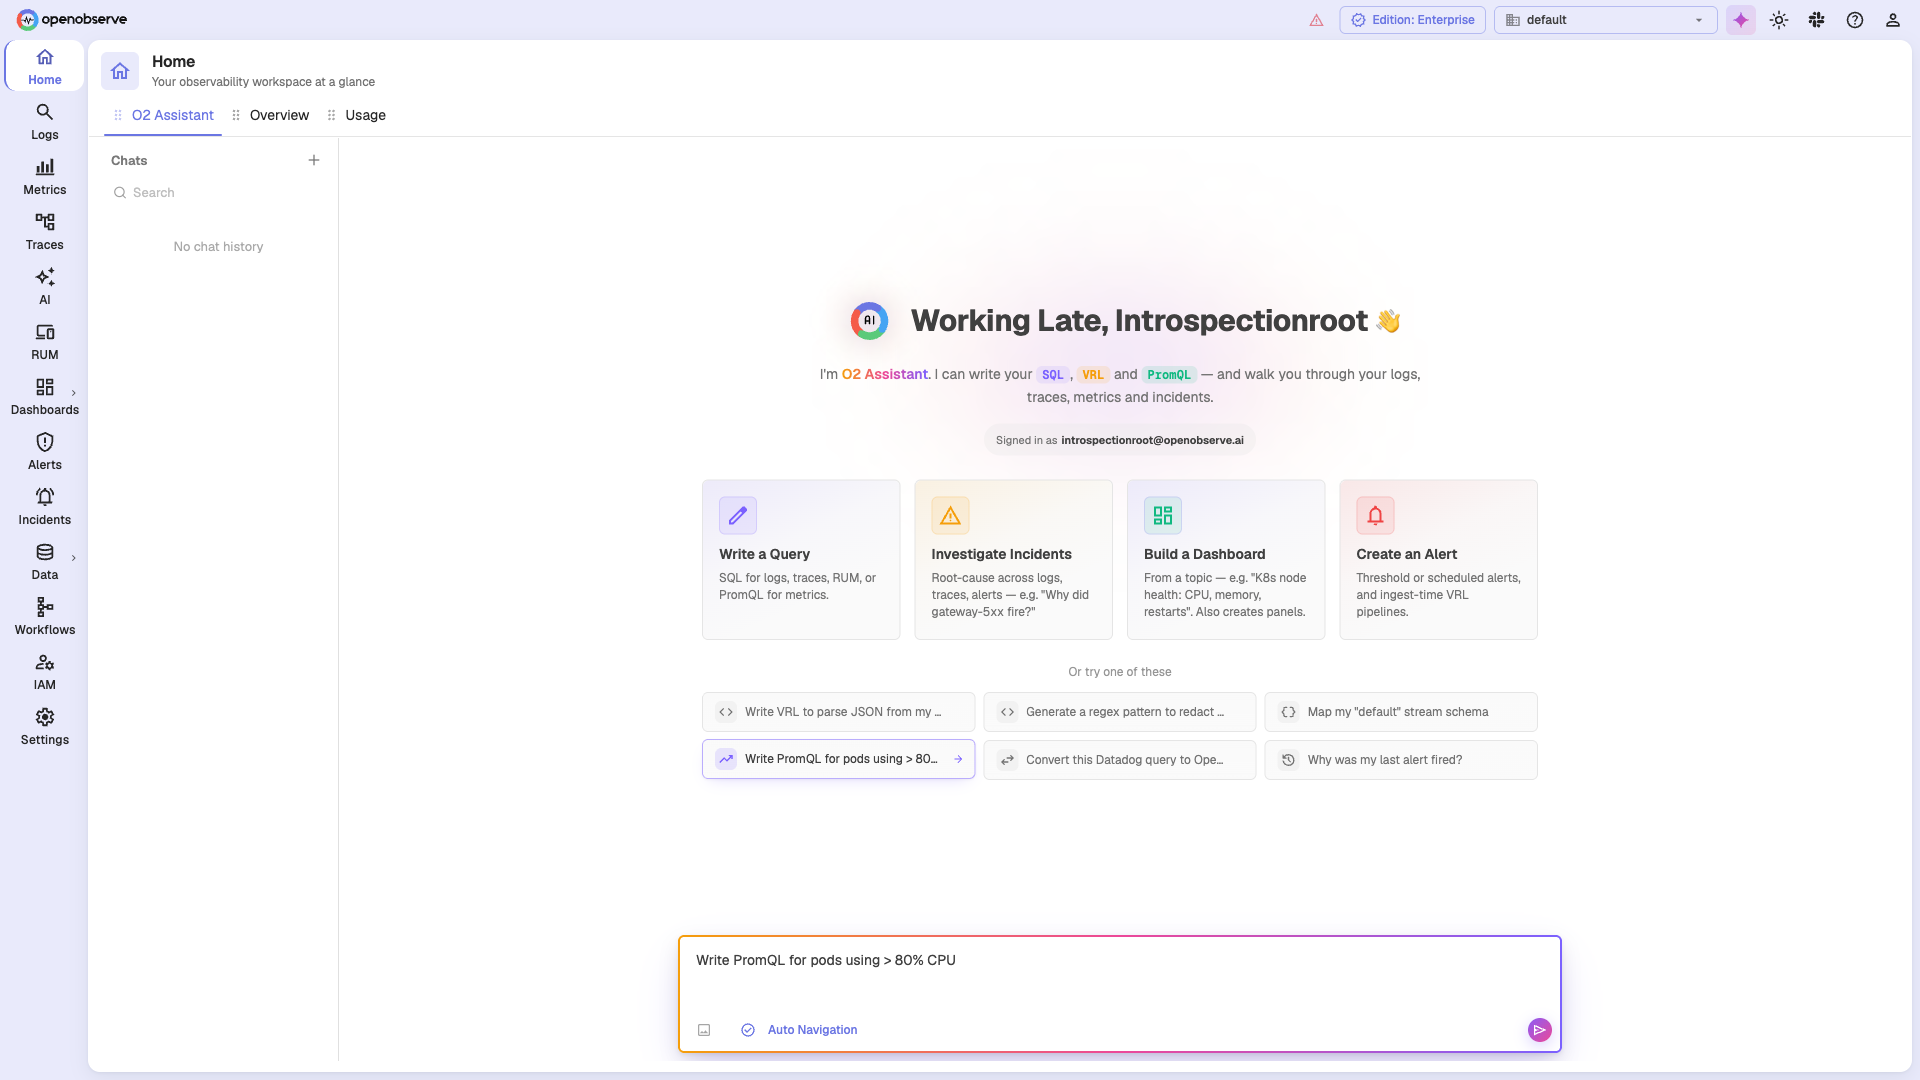
✨ O2 AI Assistant
An in-product assistant that writes your SQL, VRL, and PromQL and walks you through logs, traces, metrics, and incidents — turning natural-language questions into queries, dashboards, and alerts.
OpenObserve achieves 140x lower storage costs and high performance through a modern, cloud-native architecture:
Parquet columnar storage — efficient compression and fast analytical queries
S3-native design — inexpensive object storage with intelligent caching
Built in Rust — memory-safe, high-performance, single binary
Partitioning, indexing, and smart caching — reduces search space by up to 99% for most queries
Native multi-tenancy — organizations and streams as first-class concepts with complete data isolation
Stateless architecture — rapid scaling and low RPO/RTO for disaster recovery
Scale & Deployment
Thousands of concurrent users can query a single cluster simultaneously
Single binary scales to terabytes — unique in the observability space
High Availability mode scales to petabytes for the most demanding workloads
Multi-region deployments with cluster federation via Super Cluster architecture (Enterprise)
Federated search across regions and clusters (Enterprise)
High Availability & Disaster Recovery
Deploy in High Availability mode with clustering for mission-critical workloads requiring maximum uptime. OpenObserve's stateless architecture with S3-backed storage enables very low Recovery Point Objective (RPO) and Recovery Time Objective (RTO): stateless nodes restart rapidly, and durability is guaranteed by S3's 99.999999999% (11 nines).
Sensitive Data Redaction (SDR) — automatically redact sensitive data at ingestion and query time (Enterprise)
Single Sign-On (SSO) — OIDC, OAuth, SAML, LDAP/AD integration (Enterprise)
Role-Based Access Control (RBAC) — granular permissions (Enterprise) — Learn more →
Compliance Certifications
✅ SOC 2 Type II certified
✅ ISO 27001 certified
✅ GDPR compliant
✅ HIPAA ready (BAA available with Enterprise contracts)
OpenObserve meets the stringent security and compliance requirements of regulated industries including finance, healthcare, and government.
Enterprise Edition
OpenObserve is a true open source project. The open source edition is feature-complete and production-ready — logs, metrics, traces, dashboards, alerts, pipelines, and everything you need to run observability at scale. It will always remain actively maintained and free to use without restrictions.
For organizations that need enterprise-grade features and support, an Enterprise edition adds:
Enterprise features
Single Sign-On (SSO) — OIDC, OAuth, SAML 2.0, LDAP/AD, and major identity providers (Okta, Azure Entra, Google, GitHub, GitLab, Keycloak)
Advanced RBAC — granular role-based access control with custom roles — Learn more →
Audit trails — comprehensive immutable audit logs with configurable retention
Federated search — query across multiple clusters and regions with Super Cluster
Sensitive Data Redaction (SDR) — automatically redact PII at ingestion and query time
Advanced encryption — AES-256 SIV cipher keys with Google Tink KeySet and Akeyless integration
Query & workload management (QoS) — control query resource usage and priorities in multi-tenant environments
Support & SLAs
Dedicated support with contractual SLA guarantees and priority response times
Technical account management, architecture review, and deployment assistance
Migration support from existing tools, plus training and onboarding
Pricing
Free tier: up to 50 GB/day of ingestion (~1.5 TB/month), including full commercial use (registration required at 50 GB/day)
Volume discounts and multi-year contracts available
The best way to get help, share ideas, and connect with other OpenObserve users is through our community channels.
🔗 Join us on Slack
Our Slack community is the most active place for installation and configuration help, sharing best practices, discussing the roadmap, and connecting with the core team.
📖 Documentation — guides, tutorials, and API references
Contributing
We welcome contributions from the community! Whether you're fixing bugs, adding features, improving documentation, or sharing feedback, your help makes OpenObserve better for everyone.
To get started, read our Contributing Guide, which covers setting up your development environment, code standards, submitting pull requests, and reporting issues.
FAQ
How does OpenObserve achieve 140x lower storage costs?
Through a combination of Parquet columnar storage (efficient compression) and an S3-native architecture (inexpensive object storage). See the cost comparison chart in the Why OpenObserve? section.
What are the limitations?
All data in OpenObserve is immutable — once ingested, it cannot be modified or deleted (only entire retention periods can be dropped). This is by design and is a feature for logs and compliance use cases, ensuring data integrity and audit trails.
Is this production-ready?
Yes. OpenObserve runs in production across thousands of deployments worldwide, including environments processing in excess of 2 PB/day. See our customer stories for real-world examples.
How does query performance compare to Elasticsearch?
OpenObserve delivers better performance than Elasticsearch for most workloads, with faster search and significantly faster analytics — while using about a quarter of the hardware. The columnar Parquet format is particularly effective for complex aggregations and analytics.
Is there a steep learning curve?
No. OpenObserve is designed to be intuitive from day one:
Familiar query languages — SQL for logs and traces, PromQL for metrics; no proprietary query language to learn
Easy-to-use GUI — an intuitive interface with a drag-and-drop dashboard builder
No complex tuning — unlike Elasticsearch, there are no shards, replicas, or heap sizes to manage. Just install and go.
Most users are productive within hours, not weeks.
License
Open Source Edition — licensed under AGPL-3.0. We chose AGPL to ensure that improvements to OpenObserve remain open source and benefit the entire community, while still allowing free commercial use. Why AGPL, and why it's good for the community →
Enterprise Edition — licensed under a commercial Enterprise License Agreement (not AGPL), which provides additional flexibility for enterprise deployments.
SBOM
Software Bill of Materials for OpenObserve. You can analyze either SBOM with Dependency-Track.